Premature mortality in adults with severe mental illness (SMI)
Updated 19 April 2023

© Crown copyright 2023
This publication is licensed under the terms of the Open Government Licence v3.0 except where otherwise stated. To view this licence, visit nationalarchives.gov.uk/doc/open-government-licence/version/3 or write to the Information Policy Team, The National Archives, Kew, London TW9 4DU, or email: psi@nationalarchives.gov.uk.
Where we have identified any third party copyright information you will need to obtain permission from the copyright holders concerned.
This publication is available at https://www.gov.uk/government/publications/premature-mortality-in-adults-with-severe-mental-illness/premature-mortality-in-adults-with-severe-mental-illness-smi
Introduction
This report is about premature mortality, under the age of 75 years, in people with severe mental illness (SMI). It presents the latest data for the period 2018 to 2020 and examines trends over time since 2015 to 2017. It also describes how premature mortality in people with SMI compares with premature mortality in the population without. The report describes how for people with SMI, premature mortality varies by gender, age, socioeconomic group and geographical area in England.
The term severe mental illness is used to describe people with a group of conditions that are often chronic and so debilitating that their ability to engage in functional and occupational activities is severely impaired. SMI generally includes diagnoses such as schizophrenia, bipolar disorder or other psychotic illnesses that cause severe functional impairment.
People with SMI often experience poor physical health as well as poor mental health. They frequently develop chronic physical health conditions at a younger age than people without SMI. These chronic conditions include obesity, asthma, diabetes, chronic obstructive pulmonary disease (COPD), coronary heart disease (CHD), stroke, heart failure and liver disease. People with SMI are at increased risk of developing more than one of these chronic conditions.
These physical health problems increase the risk of premature death in people with SMI. However, as research shows, SMI is rarely recorded as an underlying cause of death, and indeed, is often not recorded on death certificates even as a contributory cause. Although people with SMI die prematurely from physical conditions, their SMI may still have been a significant feature in their lives, influencing their lifestyle, risk of developing chronic health conditions, their access to health services, and their ability to self-manage physical health conditions. It is estimated that for people with SMI, 2 out of 3 deaths are from physical illnesses that can be prevented.
Note: the most recent data period covered in this report (2018 to 2020) includes 10 months of the first year of the COVID-19 pandemic. In this report the data from 2020 cannot be disaggregated. However, a separate and companion national report using data for January 2020 to March 2021 will be available.
Note: reporting on premature mortality and excess premature mortality in people with SMI refers in this publication to people aged under 75 and in contact with mental health services.
This report is written for:
-
national organisations that lead and develop strategy, policy and guidance for the wellbeing of people with SMI
-
local organisations that plan, manage and deliver preventive, clinical and supportive services for people with SMI
-
local organisations that, along with mental health services, diagnose and treat physical health conditions in people with SMI and support them to live better with these conditions
The data is provided to help local areas understand the needs of their population and to assess if the interventions they put in place are helping to reduce premature mortality in the population with SMI.
This report describes 2 indicators that measure premature mortality in adults with SMI in England:
-
premature mortality rate in adults with SMI - this is the number of people with SMI who die under the age of 75 per 100,000, calculated as an average for a 3 year period
-
excess mortality rate in adults under 75 with SMI - this measures the difference in premature mortality rate between people with SMI and those without SMI, calculated for a 3 year period
Note: these indicators measure premature mortality in adults aged 18 to 74.
The excess premature mortality in adults with SMI indicator is published in the Public Health Outcomes Framework (PHOF), the NHS Outcomes Framework (NHS OF) and is explored in more detail in the severe mental illness profile on Fingertips. The premature mortality in adults with SMI indicator is only published in PHOF and the Fingertips profiles. Local areas can compare themselves with peers and also monitor change in their own area.
Summary of findings
Premature mortality
Adults with SMI are statistically significantly more likely to die prematurely (before the age of 75) than adults who do not have SMI in every upper tier local authority (UTLA) in England.
In the 3 years 2018 to 2020, 120,273 adults with SMI aged 18 to 74 years died, an average of just over 40,000 per year. Of these deaths:
-
70,533 were in males giving a yearly average of just over 23,500 premature deaths
-
49,740 were in females, giving a yearly average of almost 16,600 premature deaths
The rate of premature mortality in adults with SMI has increased across the time period covered in this report (2015 to 2017 through to 2018 to 2020), with the greatest increase between 2017 to 2019 and 2018 to 2020 (which includes 10 months of the COVID-19 pandemic period).
In 2018 to 2020 the rate was 104 people with SMI dying per 100,000 adults, compared with 91 people with SMI dying per 100,000 adults for 2015 to 2017. This translates into approximately 6,600 extra deaths per year in 2018 to 2020 compared with 2015 to 2017.
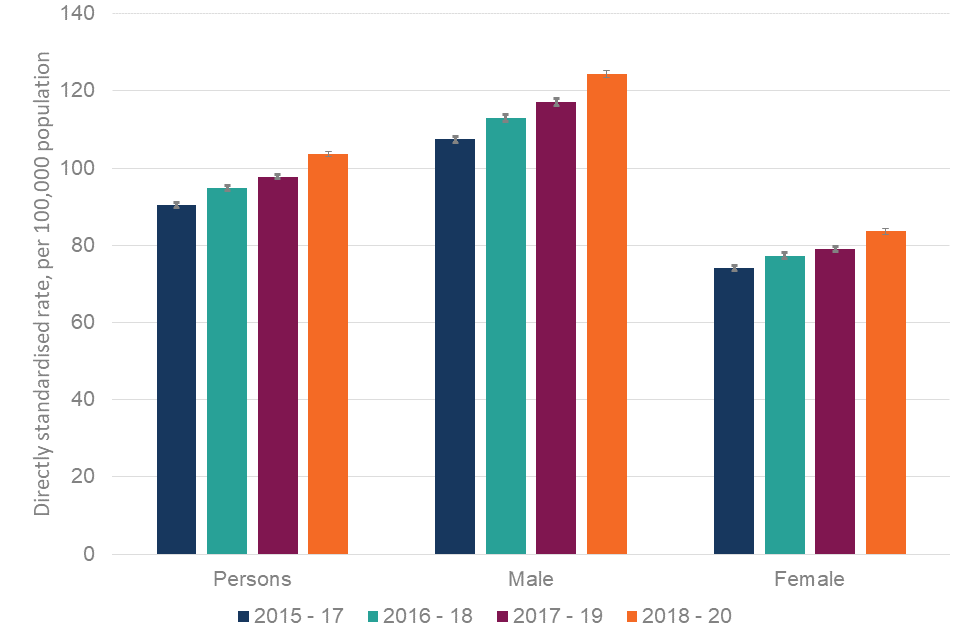
Premature mortality in adults with SMI is higher in men compared to women - in 2018 to 2020 the rate was 124 males with SMI dying per 100,000 males and 84 females with SMI dying per 100,000 females.
The increase in the rate in the most recent time period was higher in males (15.7%) than in females (12.7%). This translated into approximately 4,000 additional deaths each year for males and 2,500 additional premature deaths for females per year in 2018 to 2020 compared with 2015 to 2017.
Premature mortality for adults with SMI varies by socioeconomic group. For the period 2018 to 2020 in England, premature mortality ranged from 53.9 per 100,000 in the least deprived quintile (13,694 deaths), to 200 per 100,000 in the most deprived quintile (39,202 deaths). Premature mortality across all deprivation quintiles shows a significant increase between 2015 to 2017 and 2018 to 2020.
Premature mortality for adults with SMI varies by age. For the period 2018 to 2020 in England, premature mortality ranged from 9.8 per 100,000 for the youngest adults (371 deaths) to 431 per 100,000 for the oldest age group (35,825 deaths). Premature mortality across all age groups shows a significant increase between 2015 to 2017 and 2018 to 2020.
In the period 2018 to 2020 there was wide variation in premature mortality in adults with SMI across UTLAs in England. The range was 52 to 212 per 100,000 for adults (4 fold variation). A similar degree of variation was seen for both males and females.
Excess premature mortality
Based on data from 2018 to 2020, in England, people with SMI were around 5 times more likely to die prematurely than those who do not have SMI. This level of inequality is seen for both males and females.
Excess premature mortality, the difference in premature mortality between people with SMI and those who do not have SMI, in 2018 to 2020 increased compared to 2015 to 2017 for persons, males and females. This suggests adults with SMI are increasingly more likely to die prematurely than people without SMI.
There was wide variation in excess premature mortality in adults with SMI across England. At UTLA level, based on where they lived, the range showed that:
-
adults with SMI were from 2.5 to 7.2 times more likely to die before the age of 75 than adults without SMI
-
males with SMI were from 2.7 to 7.4 times more likely to die before the age of 75 than males without SMI
-
females with SMI were from 2.6 to 6.9 times more likely to die before the age of 75 than females without SMI
Note: while the excess premature mortality indicator is a useful summary measure at the national level for England, interpretation at UTLA level and comparison between UTLAs is complex and requires caution. The 2 following examples highlight issues to consider:
- There may be low excess premature mortality in UTLAs where premature mortality for people with SMI is very high, because premature mortality in the general population is also very high - these are usually UTLAs with high levels of deprivation.
- There may be high excess premature mortality in UTLAs where premature mortality for people with SMI is not high, because the premature mortality in the general population is even lower - this might be seen in more affluent UTLAs.
Excess premature mortality in adults with SMI varies by age. Based on data from 2018 to 2020 it is highest for middle aged adults. Those with SMI aged 30 to 49 are almost 7 times more likely to die compared to their peers without SMI. The youngest adults with SMI are 1.3 times more likely to die prematurely than their peers without SMI and the older adults with SMI are 4.6 times more likely to die prematurely than their peers.
Excess premature mortality for adults with SMI varies by socioeconomic group, however, interpretation across quintiles of deprivation is complex. Based on the period 2018 to 2020 in England, in the least deprived areas, adults with SMI are nearly 6 times more likely to die prematurely than adults who do not have SMI, and in the most deprived areas they are 3.6 times more likely to die than those without SMI. Premature mortality for people without SMI being very high in the most deprived areas contributes to this.
Findings and interpretation
When considering action to prevent premature mortality in the population with SMI, or to reduce the inequality between people with SMI and the rest of the population, it is important to think about the numbers of people living with SMI that need to be reached and supported.
Numbers reported at UTLA level can differ greatly, as both the general population size and the population with SMI differ. For instance, Manchester has an estimated population with SMI of 149,904 adults, and there were 1,545 premature deaths in that population over the 3-year period (2018 to 2020). Whereas Bath and North East Somerset has an estimated population with SMI of 25,026 adults, and there were 295 premature deaths in that population over the 3 years.
The numbers of premature deaths for all UTLAs are presented within the SMI profile. NHS England publishes supplementary data on the estimated populations of people in contact with secondary mental health services used in the calculation of the excess premature mortality indicator. The SMI profile also provides additional indicators on secondary mental health services activity to aid consideration of required action.
Geographical variation in premature mortality in adults with SMI
This indicator can be accessed in the SMI profile. The directly standardised rate (DSR) of premature mortality in adults with SMI over a 3-year period is shown for each UTLA alongside the actual number of deaths over that period. The absolute numbers help to quantify the level of need for interventions in a given area.
In England between 2018 and 2020, the DSR for premature mortality in people with SMI was 104 per 100,000 adults. There is 4-fold variation across England, from 52 per 100,000 in Oxfordshire to 212 per 100,000 in Manchester.
In England, the DSR for premature mortality in males with SMI is 124 per 100,000 population. There is 5-fold variation across England, from 47 per 100,000 in Rutland to 256 per 100,000 in Blackpool.
In England, the DSR for premature mortality in females with SMI is 84 per 100,000. There is 4.5-fold variation across England, from 41 per 100,000 in Oxfordshire to 179 per 100,000 in Manchester.
Figure 1 shows the areas with the highest rates of premature mortality for persons, males and females. These areas are Manchester, Blackpool, Middlesbrough, Stoke-on-Trent, Liverpool, Rochdale, Thurrock, Salford, Bury, Kingston upon Hull, Knowsley and South Tyneside.
Figure 1: premature mortality in adults with severe mental illness, 2018 to 2020, England. Upper tier local authorities (UTLAs) with highest 10 values
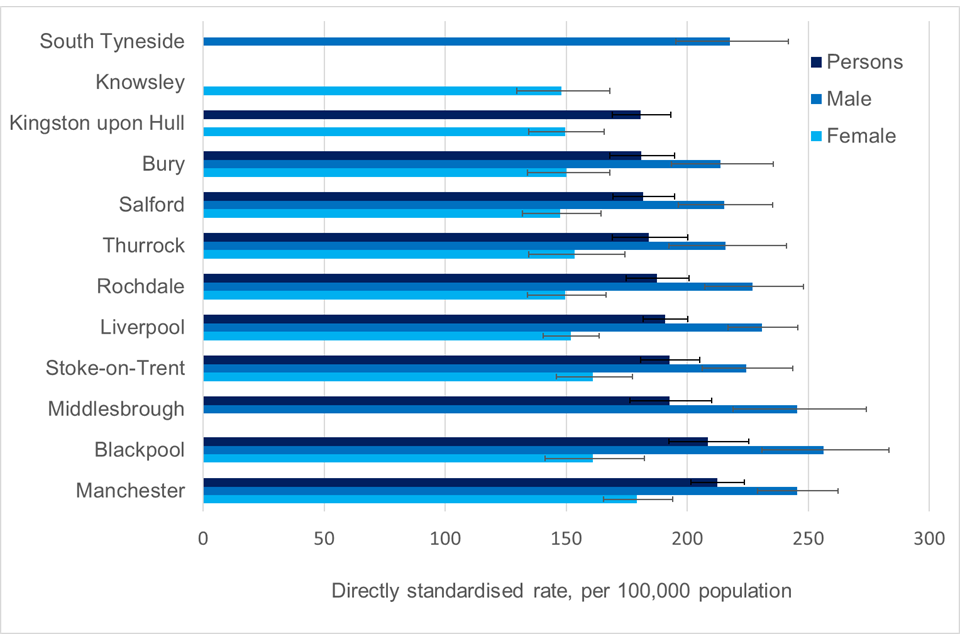
Note: the figure presents data for 12 UTLAs, this is because there is some variation in the UTLAs included in the 10 highest for persons, males and females.
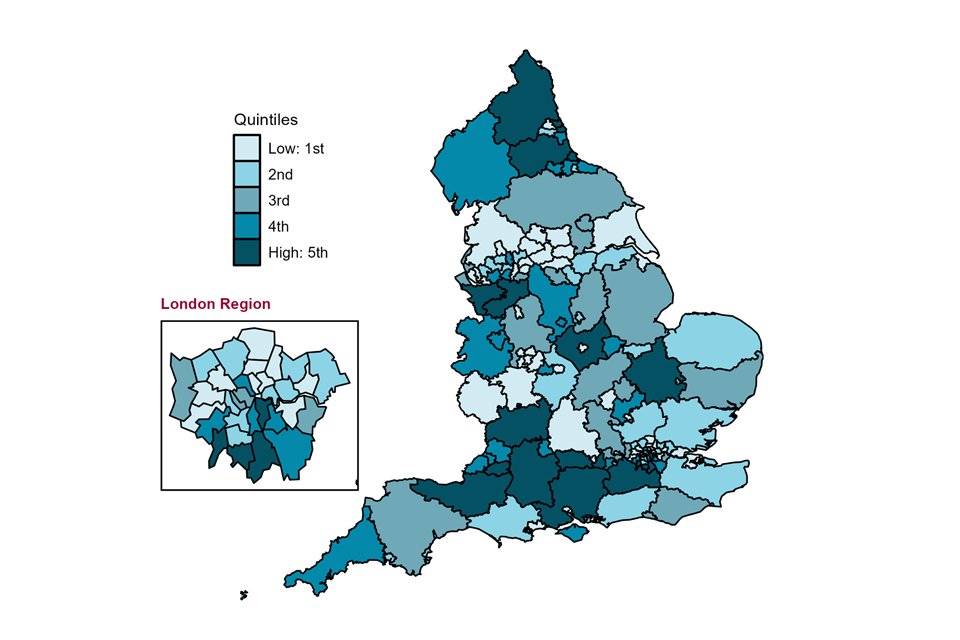
Figure 2 shows geographical variation by UTLA in the rate of premature mortality in adults with SMI. UTLA values are split in to 5 equally sized groups (same number of UTLAs in each) referred to as quintiles. These data are presented alongside figure 3, which shows variation in premature mortality in the general population.
Figure 2: map of upper tier local authorities (April 2020 to March 2021) in England for premature mortality in adults with severe mental illness. Directly standardised rate - per 100,000, 2018 to 2020
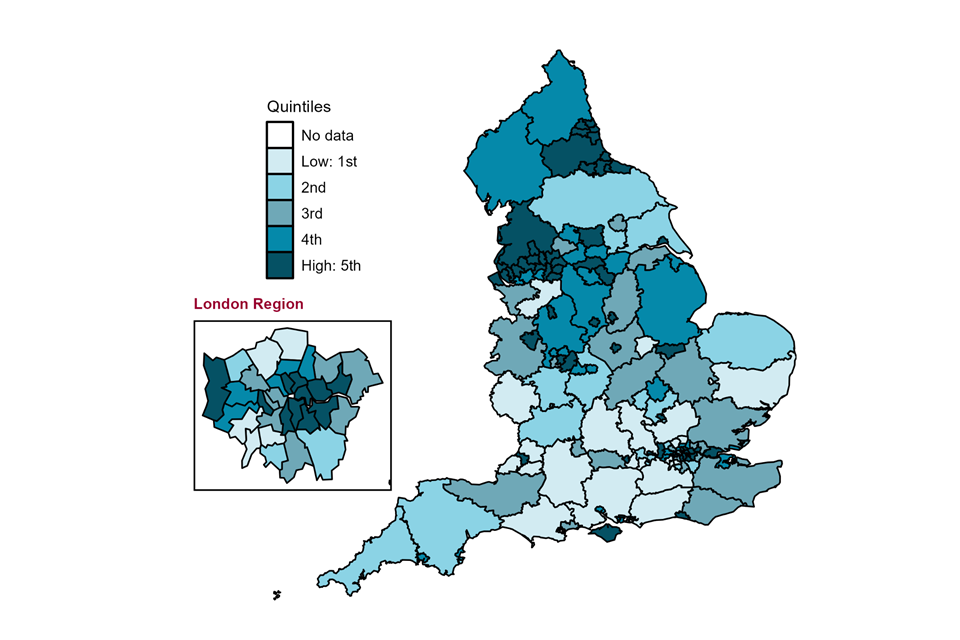
Figure 3: map of upper tier local authorities (April 2020 to March 2021) in England for premature mortality in all adults. Directly standardised rate - per 100,000, 2017 to 2019
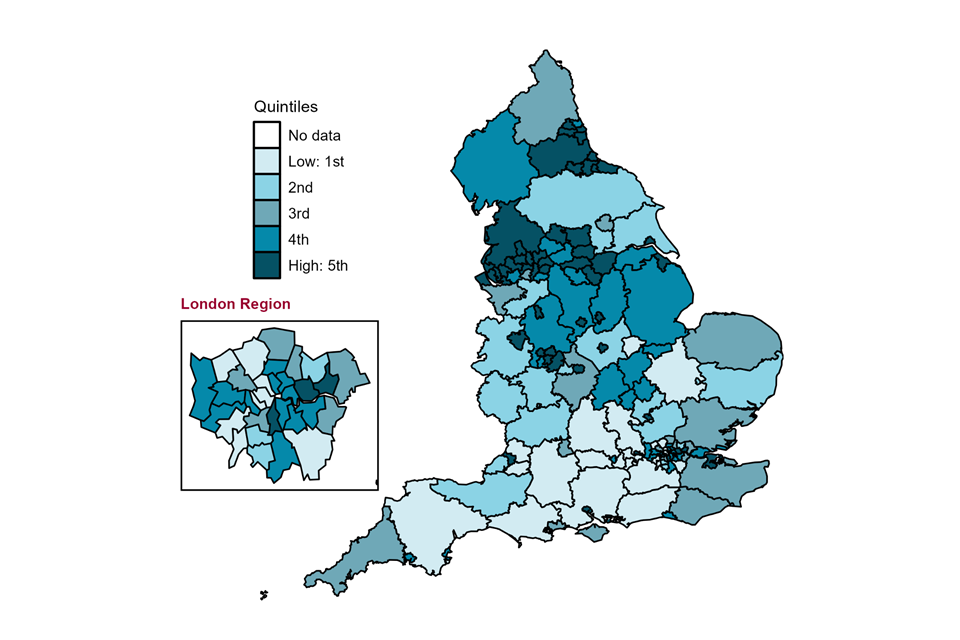
Both maps show large geographical variation with clearly higher rates of premature mortality in urban areas and in the North of England. Local areas with higher premature mortality rates in adults with SMI usually also have higher premature mortality in the general population, although not always. These areas also generally have high deprivation scores.
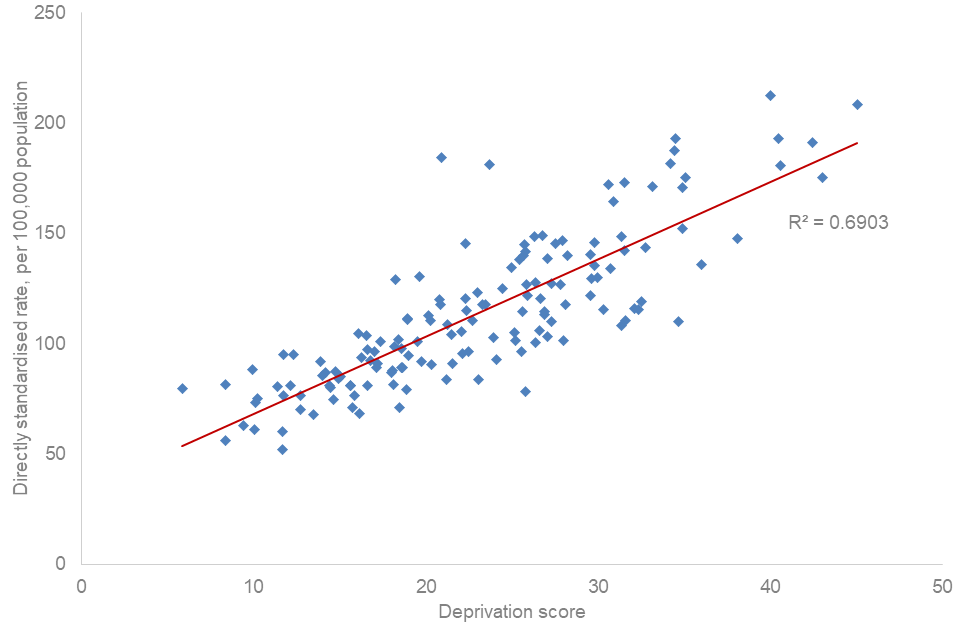
The relationship between premature mortality in adults with SMI and deprivation at UTLA level is explored in figure 4. Each data point represents a UTLA and the line shows the direction of the relationship. The R2 value measures the strength of the relationship and indicates how much of the difference in the premature mortality in adults with SMI across UTLAs can be explained by deprivation. There is a positive association (when one is higher so is the other) between premature mortality in adults with SMI and deprivation (as measured by the index of multiple deprivation (IMD)) at UTLA level. The R2 value is 0.69 which suggests that deprivation contributes about two-thirds of the variation. However, this also suggests that variation in premature mortality in the population with SMI is not driven by deprivation alone and other factors such as ethnicity and access to services may also be important.
Figure 4: relationship between premature mortality in adults with severe mental illness (directly standardised rate per 100,000 population, 2018 to 2020) and deprivation score (IMD 2019) for upper tier local authorities (April 2020 to March 2021) in England
Change in premature mortality in adults with SMI over time
Comparison of data for the periods 2015 to 2017 and 2018 to 2020 shows a significant increase in premature mortality in adults with SMI in England. As presented in figure 5, this is true for persons, males and females. The increases are:
-
14.5% increase in the rate from 91 to 104 per 100,000 population for persons, an increase of 19,749 deaths between the periods
-
15.7% increase in the rate from 108 to 124 per 100,000 population for males, an increase of 12,101 deaths between the periods
-
12.7% increase in the rate from 74 to 84 per 100,000 population for females, an increase of 7,378 deaths between the periods
Impact of the COVID-19 pandemic period
The latest data period, 2018 to 2020, includes 10 months of the COVID-19 pandemic during 2020. This includes the first and part of the second pandemic wave, when excess mortality for the population as a whole and sub-groups within it was recorded. Research shows that existing vulnerability, including in people with mental health conditions, worsened during the COVID-19 pandemic. Higher death rates seen in people with mental illness compared to the general population were associated with COVID-19 infections, as well as other causes.
Note: a separate and companion national report covering the early COVID-19 pandemic period (using data for January 2020 to March 2021) will be available in summer 2023.
Increases in the premature mortality rate in adults with SMI between the periods 2017 to 2019 and 2018 to 2020 are as follows:
-
5.9% increase in the rate from 98 to 104 per 100,000 population for persons - this is statistically significant and is an increase of 7,913 deaths between the periods
-
7.2% increase in the rate from 117 to 124 per 100,000 population for males - this is statistically significant and is an increase of 4,726 deaths between the periods
-
5.7% increase in the rate from 79 to 84 per 100,000 population for females - this is statistically significant and is an increase of 3,187 deaths between the periods
Figure 5: change over time for premature mortality in adults with severe mental illness (persons, male and female, 2015 to 2017 through to 2018 to 2020) in England
When premature mortality in adults with SMI was compared between 2015 to 2017 and 2018 to 2020 at UTLA level, 139 of the 146 UTLAs had higher premature mortality. The 5 UTLAs with the greatest increase in premature mortality were:
-
Hartlepool - the rate increased from 124.5 to 175.3 per 100,000 population
-
Barking and Dagenham - the rate increased from 93.4 to 143.4 per 100,000 population
-
Stoke-on-Trent - the rate increased from 143.4 to 192.7 per 100,000 population
-
Derby - the rate increased from 99.3 to 148.4 per 100,000 population
-
Hammersmith and Fulham - the rate increased from 100.9 to 145.2 per 100,000 population
The impact of the COVID-19 pandemic on deaths varied across England with some areas experiencing a higher increase than others. The way differences in causal and pre-existing factors (including socio-economic, ethnicity, comorbidities and lifestyle risk factors) impacted on the excess mortality is complex. Data from March to December 2020 is likely to contribute considerably to any increases recorded at UTLA level for the period for 2018 to 2020, but that impact is likely to vary.
When premature mortality in adults with SMI was compared between 2017 to 2019 and 2018 to 2020 at UTLA level, 132 of the 148 UTLAs had worse premature mortality. The top 5 UTLAs with the greatest increase were:
-
Barking and Dagenham - the rate increased from 113.3 to 143.4 per 100,000 population
-
Stoke-on-Trent - the rate increased from 166.3 to 192.7 per 100,000 population
-
Manchester - the rate increased from 187.9 to 212.4 per 100,000 population
-
Bury - the rate increased from 162.0 to 181.0 per 100,000 population
-
Hartlepool - the rate increased from 156.4 to 175.3 per 100,000 population
Inequalities in premature mortality in adults with SMI
Age
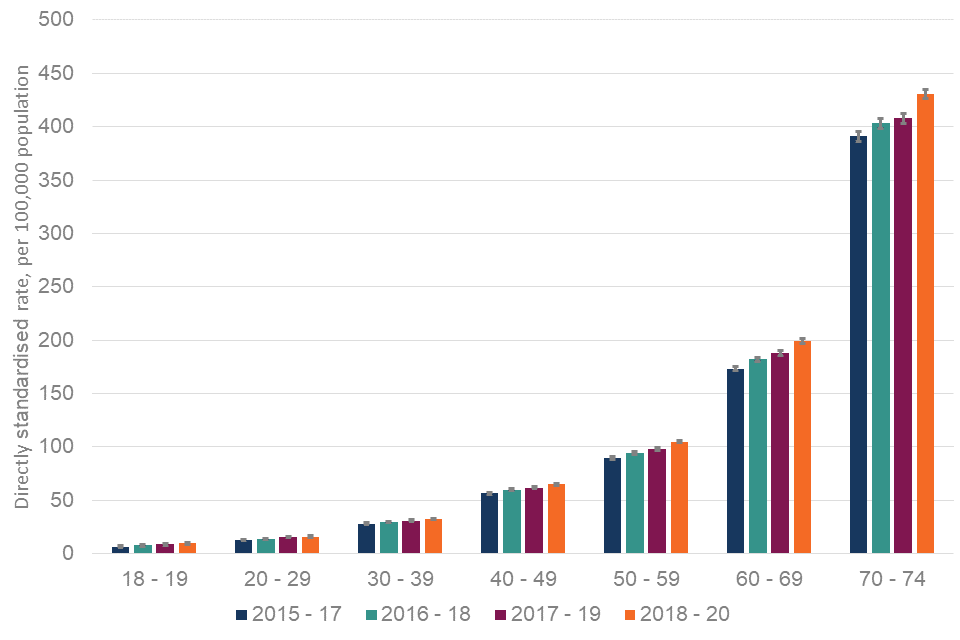
Age band specific data is presented at England-level only. There is variation by age group, with premature mortality rates increasing as the population ages. Rates show a continuous increase from 9.8 per 100,000 population for 18 to 19 year olds through to 431 per 100,000 population for 70 to 74 year olds. Age group specific death rates for adults with SMI in 2018 to 2020 are:
-
371 18 to 19 year olds - this is a rate of 9.8 per 100,000 population for 18 to 19 year olds
-
3,523 20 to 29 year olds - this is a rate of 16.1 per 100,000 population for 20 to 29 year olds
-
7,364 30 to 39 year olds - this is a rate of 32.6 per 100,000 population for 30 to 39 year olds
-
13,954 40 to 49 year olds - this is a rate of 65.1 per 100,000 population for 40 to 49 year olds
-
23,860 50 to 59 year olds - this is a rate of 105 per 100,000 population for 50 to 59 year olds
-
35,376 60 to 69 year olds - this is a rate of 199 per 100,000 population for 60 to 69 year olds
-
35,825 70 to 74 year olds - this is a rate of 431 per 100,000 population for 70 to 74 year olds
Change over time
Comparison of data for the periods 2015 to 2017 and 2018 to 2020 shows a significant increase in premature mortality in adults with SMI in England for all age groups. The increases are:
-
48.5% increase in the rate from 6.6 to 9.8 per 100,000 population for 18 to 19 year olds - this is statistically significant and is an increase of 110 deaths between the periods
-
16.0% increase in the rate from 13.3 to 16.1 per 100,000 population for 20 to 29 year olds - this is statistically significant and is an increase of 596 deaths between the periods
-
14.6% increase in the rate from 28.1 to 32.6 per 100,000 population for 30 to 39 year olds - this is statistically significant and is an increase of 1,206 deaths between the periods
-
15.7% increase in the rate from 56.8 to 65.1 per 100,000 population for 40 to 49 year olds - this is statistically significant and is an increase of 1,332 deaths between the periods
-
22.8% increase in the rate from 89.5 to 105.1 per 100,000 population for 50 to 59 year olds - this is statistically significant and is an increase of 4,423 deaths between the periods
-
15.0% increase in the rate from 173 to 199 per 100,000 population for 60 to 69 year olds - this is statistically significant and is an increase of 4,605 deaths between the periods
-
10.2% increase in the rate from 391 to 431 per 100,000 population for 70 to 74 year olds - this is statistically significant and is an increase of 7,477 deaths between the periods
The 18 to 19 year old age group has the lowest premature mortality rate (9.8 per 100,000) but the highest rate of increase (48.5%) between 2015 to 2017 and 2018 to 2020. Conversely the oldest age group (70 to 74 year olds) has the highest premature mortality rate (431 per 100,000) but the lowest rate of increase (10.2%).
Figure 6 below shows the DSRs for each data point from 2015 to 2017 through to 2018 to 2020. It shows that there has been an ongoing increase in premature mortality in all age groups across the 4 reported periods.
Figure 6: change over time for premature mortality in adults with severe mental illness (age groups, 2015 to 2017 through to 2018 to 2020) in England
The impact of the COVID-19 pandemic on deaths varied across age groups with higher excess mortality during the pandemic increasing with age. Deaths that occurred in March to December 2020 are likely to have contributed to the increases recorded for the period for 2018 to 2020, and this is likely to vary by age.
Increases in the premature mortality rate in adults with SMI between 2017 to 2019 and 2018 to 2020 are:
-
10.1% increase in the rate from 8.9 to 9.8 per 100,000 population for 18 to 19 year olds - this is not statistically significant but is an increase of 28 deaths between the periods
-
4.5% increase in the rate from 15.4 to 16.1 per 100,000 population for 20 to 29 year olds - this is not statistically significant but is an increase of 139 deaths between the periods
-
5.5% increase in the rate from 30.9 to 32.6 per 100,000 population for 30 to 39 year olds - this is statistically significant and is an increase of 420 deaths between the periods
-
5.0% increase in the rate from 62.0 to 65.1 per 100,000 population for 40 to 49 year olds - this is statistically significant and is an increase of 548 deaths between the periods
-
7.0% increase in the rate from 98.2 to 105.1 per 100,000 population for 50 to 59 year olds - this is statistically significant and is an increase of 1,813 deaths between the periods
-
6.0% increase in the rate from 188 to 199 per 100,000 population for 60 to 69 year olds - this is statistically significant and is an increase of 2,207 deaths between the periods
-
5.6% increase in the rate from 408 to 431 per 100,000 population for 70 to 74 year olds - this is statistically significant and is an increase of 2,758 deaths between the periods
Deprivation by IMD quintile
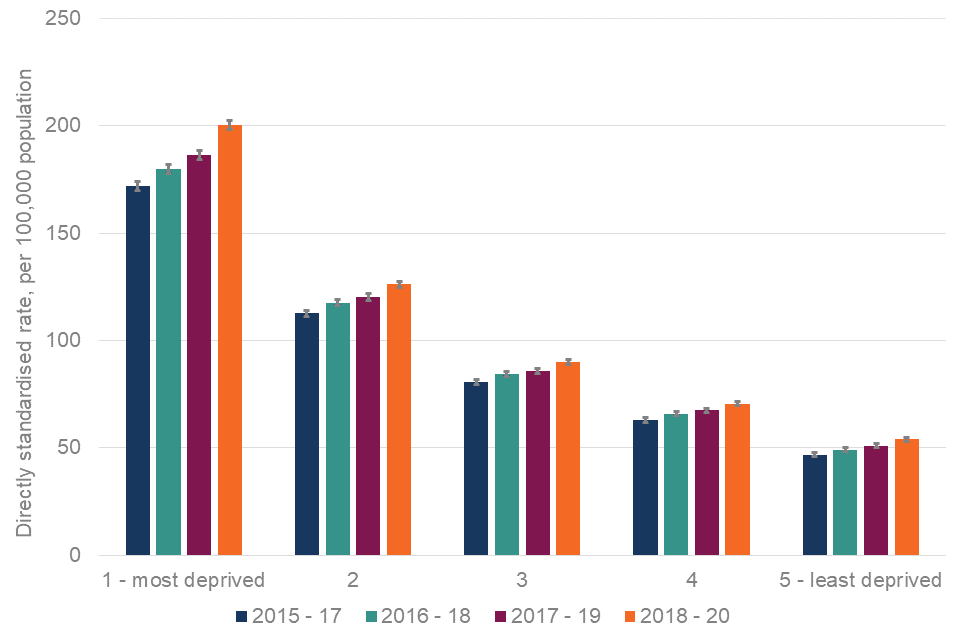
Index of multiple deprivation (IMD) quintile data is presented at England-level only. There is variation by IMD quintile, with premature mortality rates highest in the most deprived quintile at 200 per 100,000 population and lowest in in the least deprived quintile at 53.9 per 100,000 population. The quintile-specific death rates for people with SMI in 2018 to 2020 are:
-
39,202 people in IMD quintile 1 (most deprived) - this is a rate of 200 per 100,000 population for IMD quintile 1
-
27,584 people in IMD quintile 2 - this is a rate of 126 per 100,000 population for IMD quintile 2
-
21,828 people in IMD quintile 3 - this is a rate of 89.9 per 100,000 population for IMD quintile 3
-
17,830 people in IMD quintile 4 - this is a rate of 70.5 per 100,000 population for IMD quintile 4
-
13,694 people in IMD quintile 5 (least deprived) - this is a rate of 53.9 per 100,000 population for IMD quintile 5
Change over time
Comparison of data for the periods 2015 to 2017 through to 2018 to 2020 shows a significant increase in premature mortality in adults with SMI in England for all IMD quintiles. The increases are:
-
16.5% increase in the rate from 172 to 200 per 100,000 population in IMD quintile 1 (most deprived) - this is statistically significant and is an increase of 7,409 deaths between the periods
-
12.1% increase in the rate from 113 to 126 per 100,000 population in IMD quintile 2 - this is statistically significant and is an increase of 4,314 deaths between the periods
-
11.7% increase in the rate from 80.5 to 89.9 per 100,000 population in IMD quintile 3 - this is statistically significant and is an increase of 3,116 deaths between the periods
-
12.1% increase in the rate from 62.9 to 70.5 per 100,000 population in IMD quintile 4 - this is statistically significant and is an increase of 2,555 deaths between the periods
-
15.2% increase in the rate from 46.8 to 53.9 per 100,000 population in IMD quintile 5 (least deprived) - this is statistically significant and is an increase of 2,248 deaths between the periods
The most deprived quintile not only has the highest rate of premature mortality in adults with SMI, it also has the highest rate of increase (16.5%) between 2015 to 2017 and 2018 to 2020. The second highest rate of increase is in the least deprived decile (15.2%).
Figure 7 below shows the DSRs for each data point from 2015 to 2017 through to 2018 to 2020. It shows that there has been an ongoing increase in premature mortality in all IMD quintiles across the 4 reported periods.
Figure 7: change over time for premature mortality in adults with severe mental illness (IMD, 2015 to 2017 through to 2018 to 2020) in England
The impact of the COVID-19 pandemic on deaths varied by deprivation with higher excess mortality during the pandemic in more deprived populations. Premature deaths that occurred in March to December 2020 are likely to contribute to the increases recorded for the period for 2018 to 2020 and this is likely to vary for different deprivation quintiles.
The increases between 2017 to 2019 and 2018 to 2020 are:
-
7.5% increase in the rate from 186 to 200 per 100,000 population in IMD quintile 1 (most deprived) - this is statistically significant and is an increase of 3,217 deaths between the periods
-
5.0% increase in the rate from 120 to 126 per 100,000 population in IMD quintile 2 - this is statistically significant and is an increase of 1,641 deaths between the periods
-
4.9% increase in the rate from 85.7 to 89.9 per 100,000 population in IMD quintile 3 - this is statistically significant and is an increase of 1,260 deaths between the periods
-
4.6% increase in the rate from 67.4 to 70.5 per 100,000 population in IMD quintile 4 - this is statistically significant and is an increase of 916 deaths between the periods
-
5.9% increase in the rate from 50.9 to 53.9 per 100,000 population in IMD quintile 5 (least deprived) - this is statistically significant and is an increase of 868 deaths between the periods
Note: for all deprivation-based analysis, the 2015 to 2017 and 2016 to 2018 figures use IMD 2015, whereas 2017 to 2019 and 2018 to 2020 figures use IMD 2019.
Excess premature mortality in adults with SMI
Using the excess premature mortality indicator
This indicator quantifies the difference in premature mortality between those with SMI and those who do not have SMI. In England overall and in every UTLA a greater proportion of people with SMI die before the age of 75 than of people who do not have SMI.
Although no UTLA in England has this, a value of 0% would mean that people with SMI are equally likely to die under the age of 75 as people who do not have SMI. Figures higher than 0% indicate that people with SMI are more likely to die early than people who do not have SMI. The % value quantifies the inequality, a value of 100% indicates people with SMI are twice as likely to die prematurely than people who do not have SMI, and a value of 200% indicates they are 3 times as likely to die prematurely. For example, if the indicator value is 247%, the risk of dying prematurely for those with SMI is 247% higher than for those who do not have SMI. This can also be expressed as people with SMI being almost 3.5 times more likely to die prematurely than those who do not have SMI.
Geographical variation in excess premature mortality in adults with SMI
The excess premature mortality value for adults with SMI in England is 390%. This can also be expressed as people with SMI are almost 5 times as likely to die prematurely than those who do not have SMI. At a local level, figures vary from 154% (2.5 times more likely to die) in Kingston upon Hull to 615% (more than 7 times more likely to die) in Bath and North East Somerset.
The excess premature mortality value for males with SMI is 387% (almost 5 times more likely). Local figures vary from 173% (2.75 times more likely) in Kingston upon Hull to 636% (more than 7 times more likely) in Bath and North East Somerset.
The excess premature mortality value for females with SMI is 403% (5 times more likely). Local figures vary from 158% (more than 2.5 times more likely) in Kingston upon Hull to 589% (almost 7 times more likely) in Bath and North East Somerset.
Figure 8 shows the variation in the rate of excess premature mortality in the population with SMI. UTLA values are split in to 5 equally sized groups (same number of UTLAs) referred to as quintiles. Although large differences between UTLAs exists, the geographical pattern is more complex than for premature mortality rates.
Figure 8: map of upper tier local authorities (April 2020 to March 2021) in England for excess premature mortality in adults with severe mental illness. Excess risk - %, 2018 to 2020
Change in excess premature mortality over time
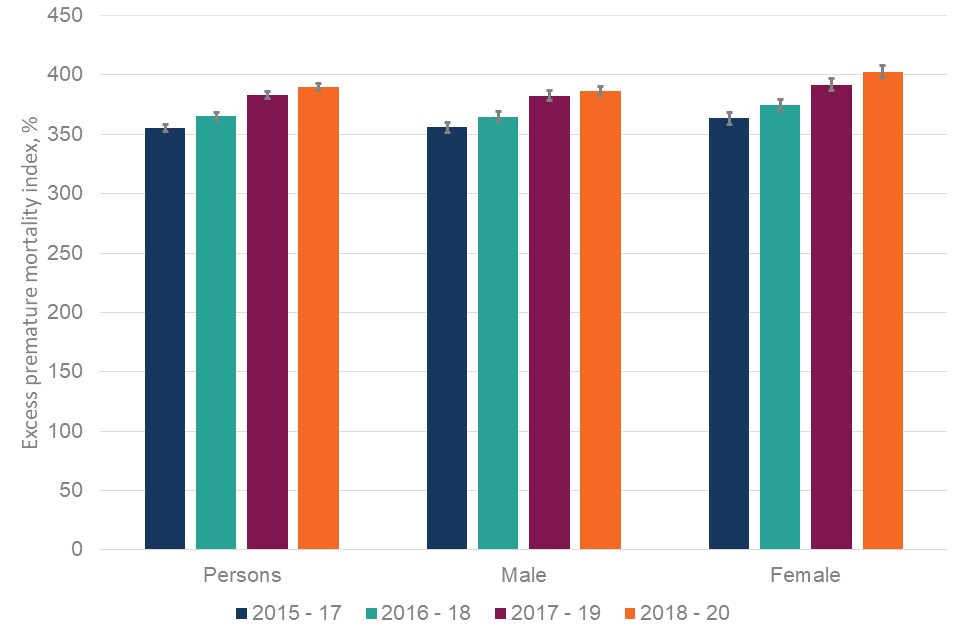
Comparison of data for the periods 2015 to 2017 and 2018 to 2020 shows a statistically significant increase in the excess premature mortality in adults with SMI in England. As presented in figure 9 this is true for persons, males and females. Values increased from:
-
355% to 390% for persons
-
356% to 387% for males
-
364% to 403% for females
Figure 9: change over time for excess premature mortality in adults with severe mental illness (persons, male and female, 2015 to 2017 through to 2018 to 2020) in England
108 UTLAs in England showed an increase in excess premature mortality for 2018 to 2020 compared to 2015 to 2017, with 25 areas showing a significant change.
Excess premature mortality has been calculated at UTLA level. This is primarily so local services can assess and understand inequality in their own area. Any comparison between areas requires careful interpretation.
For example, where the excess premature mortality between local populations with and without SMI is small, the numbers of people with SMI dying early may be high - but whole population premature mortality is also high, and therefore the difference between the 2 groups is smaller. In contrast, local areas with high excess premature mortality are often rural or more affluent. They generally have a longer life expectancy for the population as a whole and, therefore, the difference in premature mortality between those with SMI and those without SMI may be greater, although numbers of adults with SMI may be relatively low. However, some areas with higher deprivation and higher general population premature mortality do also have high excess premature mortality in the population with SMI.
It should be stressed that areas where the excess premature mortality is high but the overall SMI population is small are also important. People with SMI in these areas may be harder to reach and effort is needed to support communities with smaller SMI populations to reduce this large mortality gap.
Inequalities in excess premature mortality in adults with SMI
Age
Age group specific data is presented at the England-level only. There is variation by age group but little obvious pattern. The lowest rate of excess premature mortality is seen in the 18 to 19 age group, with the highest in the 30 to 39 and 40 to 49 age groups. Breakdowns for all ages are:
-
129% for 18 to 19 year olds
-
430% for 20 to 29 year olds
-
612% for 30 to 39 year olds
-
549% for 40 to 49 year olds
-
396% for 50 to 59 year olds
-
354% for 60 to 69 year olds
-
363% for 70 to 74 year olds
Change over time
Comparison of data for the periods 2015 to 2017 and 2018 to 2020 by age group shows a mixed picture for change in excess premature mortality in adults with SMI in England. Age groups 40 to 49 and older show an increase, whereas as those aged 30 to 39 and below show a decrease, or no obvious change. The changes over time are:
-
127% to 129% for 18 to 19 year olds - not statistically significant
-
437% to 430% for 20 to 29 year olds - a reduction, but not statistically significant
-
633% to 612% for 30 to 39 year olds - a reduction, but not statistically significant
-
522% to 549% for 40 to 49 year olds - statistically significant
-
370% to 396% for 50 to 59 year olds - statistically significant
-
331% to 354% for 60 to 69 year olds - statistically significant
-
306% to 363% for 70 to 74 year olds - statistically significant
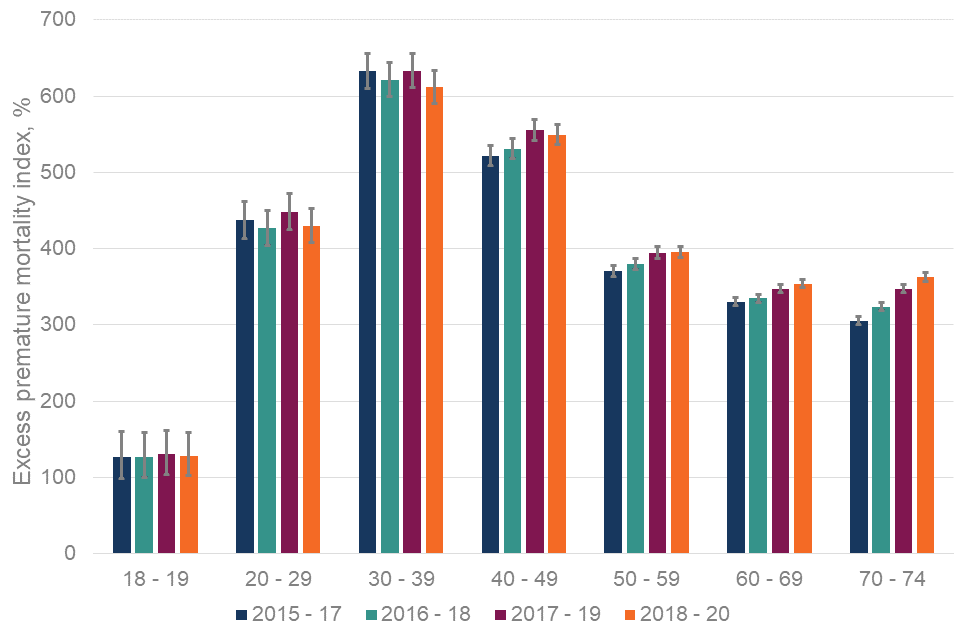
Figure 10 shows each data point from 2015 to 2017 through to 2018 to 2020. It shows a mixed picture of excess premature mortality where 30 to 39 and 40 to 49 year olds consistently show the highest excess premature mortality, whereas the 50 to 59, 60 to 69 and 70 to 74 age groups show an ongoing increase across the 4 reported periods.
Figure 10: change over time for excess premature mortality in adults with severe mental illness (age groups, 2015 to 2017 through to 2018 to 2020) in England
Deprivation by IMD quintile
Index of multiple deprivation quintile data is presented at England-level only. There is variation by IMD quintile, with excess premature mortality highest in the least deprived quintile at 490% compared to 264% in the most deprived quintile. The quintile specific rates are:
-
264% for quintile 1 (most deprived)
-
340% for quintile 2
-
406% for quintile 3
-
449% for quintile 4
-
490% for quintile 5 (least deprived)
Change over time
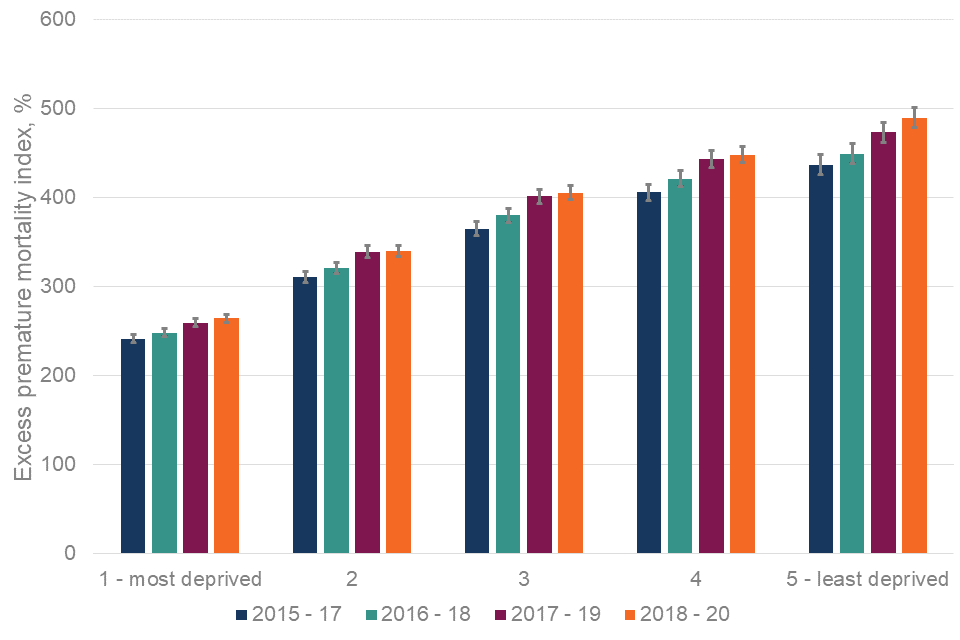
Comparison of data for the periods 2015 to 2017 and 2018 to 2020 show a significant increase in excess premature mortality in adults with SMI in England. As presented in figure 11, this is true for all IMD quintiles, with the highest percentage point increase in the least deprived quintile. The increases are:
-
242% to 264% for IMD quintile 1 (most deprived) - statistically significant
-
311% to 340% for IMD quintile 2 - statistically significant
-
365% to 406% for IMD quintile 3 - statistically significant
-
406% to 449% for IMD quintile 4 - statistically significant
-
437% to 490% for IMD quintile 5 (least deprived) - statistically significant
The least deprived quintile not only has the highest excess premature mortality in adults with SMI, it also has the highest rate of increase (54%) between the 2 periods. The most deprived quintile has the lowest excess premature mortality and the lowest rate of increase between the 2 periods (22%).
Figure 11 below shows the figures for each data point from 2015 to 2017 through to 2018 to 2020. It shows that there has been an ongoing increase in excess premature mortality in all IMD quintiles across the 4 reported periods.
Figure 11: change over time for excess premature mortality in adults with severe mental illness (IMD, 2015 to 2017 through to 2018 to 2020) in England
Note: for all deprivation-based analysis the 2015 to 2017 and 2016 to 2018 figures use IMD 2015, whereas 2017 to 2019 and 2018 to 2020 figures use IMD 2019.
Areas in England of particular interest
Understanding relationships between important factors
Data presented in this report shows clearly that premature mortality in adults with SMI warrants attention and needs to be reduced everywhere in England. However, some areas have more challenging circumstances than others and need attention. This section of the report aims to identify different challenges facing UTLAs in planning services to prevent premature mortality in people with SMI.
To understand what these figures mean locally, both indicators and the relationship between them should be considered. It is also important to consider the relationship with general population premature mortality and levels of local deprivation. The figures below explore these relationships and also highlight the complex nature of what is happening across England.
Figure 12 explores the relationship between excess premature mortality in adults with SMI in 2018 to 2020 and deprivation score (IMD).
Figure 12: relationship between excess premature mortality in adults with severe mental illness (excess risk - %, 2018 to 2020) and deprivation score (IMD 2019) for upper tier local authorities (April 2020 to March 2021) in England
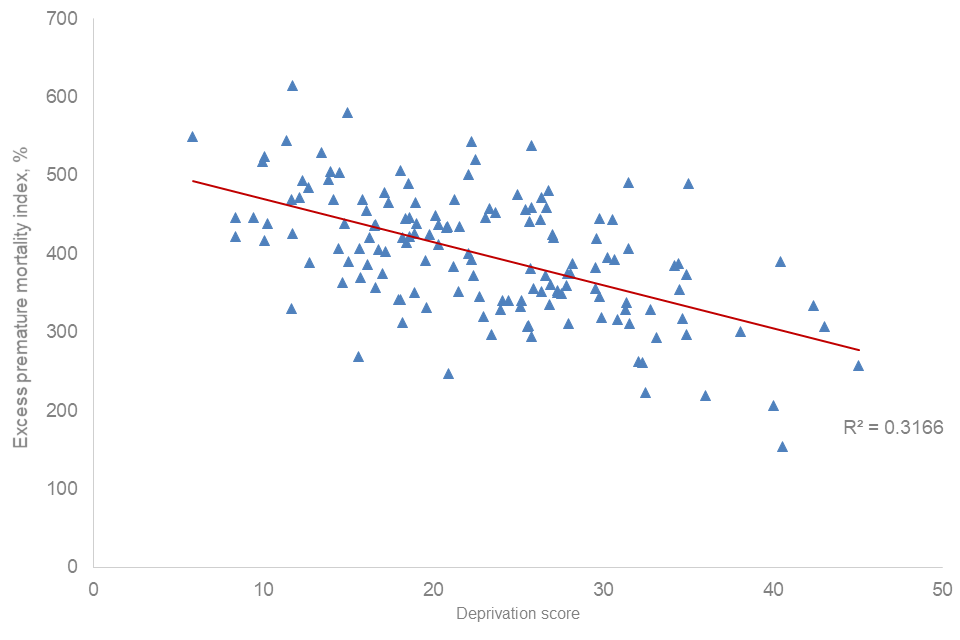
There is an inverse relationship between excess premature mortality for people with SMI and deprivation score (higher excess premature mortality in areas of lower deprivation). However, this relationship is weak (R2 = 0.32) accounting for around one third of the variation. Some of the most deprived UTLAs in the country have the lowest excess premature mortality for people with SMI.
Many UTLAs with high rates of premature mortality in people with SMI also experience high rates of premature mortality in the general population. Figure 13 explores this relationship.
Figure 13: relationship between premature mortality in adults with severe mental illness and premature mortality in adults in the general population (directly standardised rate per 100,000 population, 2018 to 2020) for upper tier local authorities in England (April 2020 to March 2021)
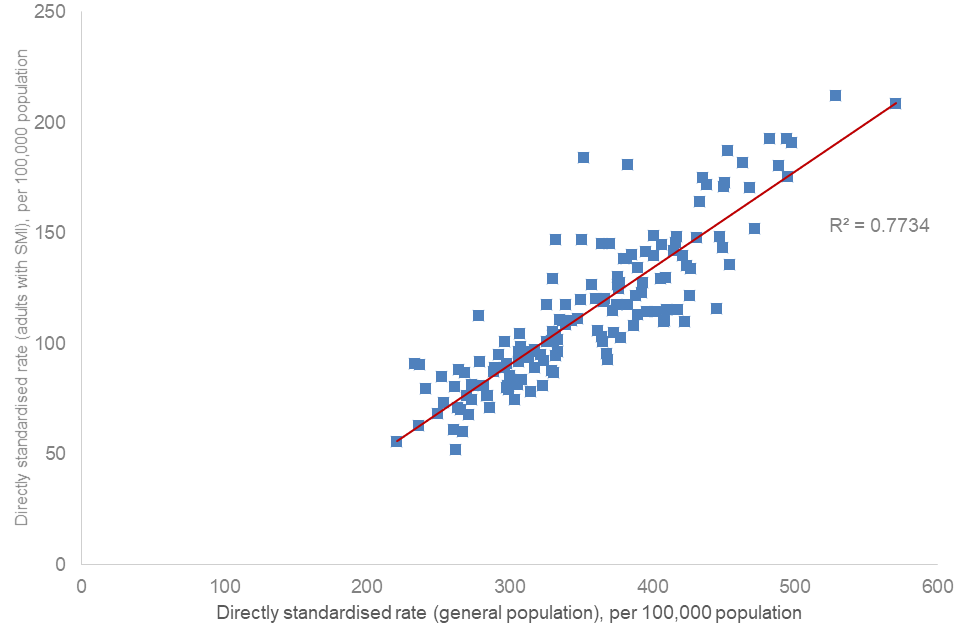
There is a positive association between premature mortality in adults with SMI and premature mortality in the general population. The association is strong (R2 0.77), accounting for more than 75% of the variation across UTLAs in England.
Identifying areas of interest
So far, UTLAs in England where people are more likely to have an SMI and die prematurely, or where the inequality between this group and people without SMI is greatest, have been considered. Interpreting and using this data has some complexity to it. The inter-relationship with premature mortality in the population overall, life expectancy and levels of deprivation are all part of the picture.
UTLAs were identified as being “of particular interest” if they had a value in the highest 40% (top 2 quintiles) for one or both indicators. This method highlighted that in England 101 of the 149 UTLAs were of interest. These UTLAs were divided into 4 distinct groups. To show patterns by region summary tables are presented. Full lists of all UTLAs in each group and the 5 relevant measures for each are included in the Supplementary information section of the report.
Note: other UTLAs not allocated to these groups still require action to address the high rates of premature mortality experienced by people with SMI.
The identified groups of UTLAs of interest are as follows and are presented in figure 14.
Group 1: UTLAs with high SMI premature mortality and high overall premature mortality
There are 35 UTLAs in this group with more in the north of the country than other regions. There are:
-
3 UTLAs in the North East
-
14 UTLAs in the North West
-
4 UTLAs in the Yorkshire and the Humber
-
2 UTLAs in the East Midlands
-
4 UTLAs in the West Midlands
-
2 UTLAs in the East of England
-
3 UTLAs in London
-
2 UTLAs in the South East
-
1 UTLA in the South West
These areas generally have among the most deprived populations in the country and also large numbers of people with SMI. They require whole population action to address overall premature mortality and within that action specifically for people with SMI.
These UTLAs are shown as Group 1 on figure 14.
Group 2: UTLAs with high SMI premature mortality but not high overall premature mortality
There are 6 UTLAs in this group with the highest proportion in London:
-
1 UTLA in the East of England region
-
5 UTLAs in London
Most of these areas are in London and are generally more urban. They are areas where premature mortality in those with SMI does not appear to be clearly linked to premature mortality in the population overall. They required specific action for people with SMI.
These UTLAs are shown as Group 2 on figure 14.
Group 3: UTLAs with high SMI premature mortality and high SMI excess premature mortality
There are 19 UTLAs in this group with the highest proportion in the northern regions. There are:
-
8 UTLAs in the North East
-
3 UTLAs in the North West
-
1 UTLA in the East Midlands
-
1 UTLA in the West Midlands
-
3 UTLAs in London
-
2 UTLAs in the South East
-
1 UTLA in the South West
These areas are usually more deprived but have relatively small SMI populations. High rates for both indicators suggest adults with SMI are in need - these areas require specific action for people with SMI.
These UTLAs are shown as Group 3 on figure 14.
Group 4: UTLAs with high SMI excess premature mortality but not among the highest SMI premature mortality
There are 41 UTLAs in this group with the highest proportion in London and the southern regions. There are:
-
1 UTLA in the North East
-
5 UTLAs in the North West
-
2 UTLAs in the Yorkshire and the Humber
-
5 UTLAs in the East Midlands
-
3 UTLAs in the West Midlands
-
3 UTLAs in the East of England
-
7 UTLAs in London
-
6 UTLAs in the South East
-
9 UTLAs in the South West
These areas mostly have among the most affluent populations in the country and have relatively small SMI populations. Although numbers of people with SMI in these areas are low, their needs matter. They may have more difficulty in reaching services - specific action is required.
These UTLAs are shown as Group 4 on figure 14.
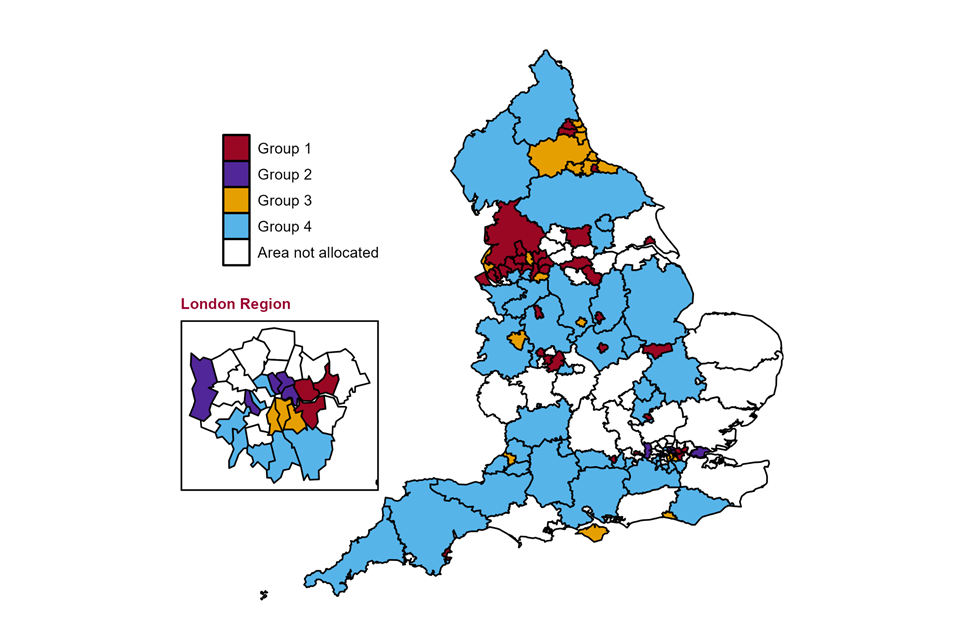
Figure 14 shows the locations of the 4 groups of UTLAs described above. The ‘areas not allocated’ group is those UTLAs that do not fall within the 4 groups. Although they have not been identified as being of particular interest, it remains the case that the rates of premature mortality among people with SMI in these areas is much higher than the rates of premature mortality in the population that do not have SMI.
Figure 14: map showing upper tier local authorities (April 2020 to March 2021) of interest for intervention to address premature mortality in adults with SMI, in England
Data on premature mortality in adults with SMI, premature mortality in the population overall and excess premature mortality in adults with SMI is available from the Fingertips profiles using the ‘Map’ data view.
Conclusion
Overwhelmingly, the data shows that people with SMI are more likely to die prematurely than people who do not have SMI, and the gap between these 2 groups has continued to increase in recent years (the period covered by these indicators is 2015 to 2017 through to 2018 to 2020).
In England, people with SMI are 5 times more likely to die before the age of 75 than those who do not have SMI. Furthermore, in all UTLAs, adults with SMI are more likely to die prematurely than their peers without SMI. Even in the local authority with the lowest excess premature mortality, those with SMI are 154% or 2.5 times more likely to die prematurely than those who do not have SMI.
As much as there is geographical inequality, there is also demographic and socio-economic inequality. Available data shows that:
-
more adult men with SMI die prematurely than adult women with SMI
-
the rate of increase over the last 4 reporting periods is faster for adult women with SMI than adult men with SMI
-
more adults in older age groups with SMI die prematurely than adults with SMI in younger age groups
-
the rate of increase over the last 4 reporting periods is fastest in the youngest adult group (18 to 19 years)
-
4 times as many adults with SMI in the most deprived IMD quintile die prematurely than adults with SMI in the least deprived quintile
-
the rate of increase in premature mortality in adults with SMI is faster in the most deprived quintile than any other quintile
The most recent data is available on the SMI profile. This data suggests premature mortality in people with SMI continues to increase and that excess premature mortality is also increasing.
All areas in England should seek to reduce premature mortality in the population with SMI, and work to implement interventions to address this. Local area planners, commissioners and service providers should use the indicators presented in this report to add to their understanding of the inequality people with SMI in their areas face and to help determine what action to take.
The indicator ‘Premature mortality in adults with SMI’ measures the absolute impact of mortality. It shows which UTLAs have the highest rates of people with SMI dying early. The data associated with the indicator includes the number of people who have died. This indicator can and should be used as an outcome measure. For example, it can be used to assess if interventions to support people with SMI are making a difference over time.
The indicator ‘Excess under 75 mortality rate in adults with SMI’ measures the inequality in mortality. It shows the difference in premature mortality between people with SMI and the rest of the population. This indicator is primarily for use at either national or local level. It should be recognised that comparison between local areas needs to be considerate of the potential for there to be greater inequality seen in more affluent areas (where numbers of people with SMI are lower) and that areas with less inequality (more deprived areas) may be the places where more people with SMI are dying prematurely.
Indicators that describe the prevalence of SMI in local areas and rates of access to services (found in the severe mental illness profile) can be used to further understand the local picture of SMI.
It is through looking at this wider information that areas will be best placed to determine what interventions are needed to address premature mortality in their population with SMI.
Next steps
Analytical work is under way to improve and increase the data available to help broaden understanding of the inequality in premature mortality that people with SMI face.
There is data already released (but not covered in this report) on England and UTLA level condition-specific indicators for premature and excess premature mortality in the population with SMI for cancer, cardiovascular disease, liver disease and respiratory disease - these conditions will be the subject of a series of follow up reports.
In 2023, NHS geographies will be added to these indicators.
Supplementary information
Policy and initiatives to address the inequality
In light of the inequalities in the physical health and premature mortality of people with SMI in comparison to the general population, the needs of people with SMI have been recognised in government and healthcare mental health policy and strategy in recent years. Furthermore, a number of initiatives have been launched to raise awareness of this issue. Some of the key policy documents and initiatives are outlined below.
In light of persistent inequalities in premature mortality for people with SMI, NHS England has been undertaking the following range of activities to seek to close this gap.
-
A programme of work to support the NHS Long-Term Plan ambition to deliver 390,000 annual physical health checks for people with SMI by the end of March 2024, and to encourage systems to provide supported follow-up interventions. This includes national guidance, training for primary care staff, analysing inequalities in uptake of checks to inform targeted interventions, and providing outreach funding for local systems to increase uptake of checks, COVID-19 and flu vaccinations.
-
Work to transform community mental health services and redesign them around Primary Care Networks (PCNs), to enable people with SMI to have greater choice and control over their care, and support them to live well in their communities. This requires close partnership working across primary care, mental health, voluntary and community sector organisations and local authorities. As part of this transformation, more people can receive trauma-informed support for their mental health within primary care, particularly through embedded mental health practitioners.
-
Incorporating SMI physical health checks as one of 5 clinical priority areas, alongside smoking cessation, in Core20PLUS5. Core20PLUS5 is NHS England’s flagship approach for tackling health inequalities, which all integrated care boards (ICBs) have been asked to embed as a matter of priority, including in operational planning and Joint Forward Plan guidance. Core20PLUS5 includes a community connectors programme (where influential local people in communities are recruited to help engage people in local health services), and Core20PLUS5 ambassadors (who promote the importance of reducing inequalities across the healthcare system).
-
A range of prevention programmes, including community-based bespoke specialist tobacco dependency services for people with severe mental illness (currently being piloted across 7 systems in England) and inpatient tobacco dependency treatment services (being rolled out across mental health inpatient settings). There is a national quality improvement programme to ensure they are successfully embedded and there are training resources to support delivery.
The NHS Long Term Plan
The NHS Long Term Plan (2019) sets out a cross-system package of support for people with SMI. Deliverables include increasing access to physical health checks, individual placement and support for employment and an ambition to transform community care for adults with SMI.
The plan acknowledges that people with SMI are at higher risk of poor physical health and outlines a number of commitments to help overcome the health inequalities. Over time, the indicators in this briefing will enable measurement of the effectiveness of NHS Long Term Plan policies in reducing premature mortality and the inequality between people with SMI and people without SMI.
COVID-19 mental health and wellbeing recovery action plan
The COVID-19 mental health and wellbeing recovery action plan (2021) seeks to prevent, mitigate and respond to the mental health impacts of the pandemic during 2021 to 2022. It highlights the challenges people with SMI have faced during the pandemic and commits to making holistic and joined up support for this group a priority area for action during 2023 and beyond.
As part of the £500 million announced to support mental health recovery, NHS England and NHS Improvement have invested a further £14 million to work across primary and secondary care services with voluntary and community sector partners. This will deliver tailored outreach for people living with SMI to increase their engagement with physical health checks, and uptake of flu and COVID-19 vaccinations. An additional £12 million has also been provided in financial year 2022 to 2023 and again in financial year 2023 to 2024 for this purpose.
Equally Well UK
Equally Well UK is an initiative which seeks to promote and support collaborative action to improve physical health among people with a mental illness. It is hosted by the Centre for Mental Health in partnership with Rethink Mental Illness. It has a broad and growing membership of organisations who in signing up make a commitment to prioritising physical health for people with mental health problems, as well as pledging to play their part in reducing the inequalities.
Other organisations, initiatives and publications
OHID (when operating as Public Health England) developed a series of guidance, data and tools to help professionals to better understand the issues for people with SMI in their area and to help them to address the wider determinants of health and risk factors. These are summarised in Health matters: reducing health inequalities in mental illness.
NHS RightCare provides a set of resources to support systems to concentrate their improvement efforts where there is greatest opportunity to address variation and improve population health. The ‘toolkits’ section of the website includes relevant workstreams on cardiovascular disease, respiratory disease and diabetes.
The NHS RightCare physical ill-health and cardiovascular disease prevention in people with SMI toolkit defines the core components of an optimal service for people with SMI who are at risk of developing CVD.
NHS England guidance for clinical commissioning groups (CCGs) on improving physical healthcare for people living with SMI highlights the responsibilities of CCGs to commission services that deliver comprehensive physical health assessments and follow up care to people on the SMI register in primary care.
The National Institute of Health and Care Excellence (NICE) psychosis and schizophrenia in adults: prevention and management guidelines cover recognising and managing psychosis and schizophrenia in adults. They aim to improve care through early recognition and treatment, and by concentrating on long-term recovery. They also recommend checking for coexisting health problems and providing support for family members and carers.
The shared learning database published by NICE has some example of initiatives on improving physical health for people with SMI, including projects on a quality improvement approach and the mental health physical review templates. The projects provide an example of how to use a multi-professional team approach to design, implement and test interventions to improve physical health. It provides an example of a successful implementation of electronic templates for primary care teams to carry out high quality, systematic annual physical health checks, including a calculation of the risk of dying from CVD known as a QRisk2 score.
Closing the Gap is a network to understand why people with severe mental illness have some of the worst physical health issues of any section of the population. The network draws together population health, primary care, health services research, evidence synthesis, health economics, digital health, environmental science and the creative arts.
Methodology
Data sources, cohort definition and indicator method
Data sources used for these indicators are:
-
Office for National Statistics Civil Registration of Deaths
-
Mental Health Services Data Set (MHSDS) and its predecessors
-
Office for National Statistics mid-year population estimates
Although the Quality and Outcomes Framework (QOF) is a practice-level register of people with SMI across England, nationally it provides aggregate data (data for groups of people rather than individuals) only. This data cannot be used in this work as linkage to deaths data is not possible. These indicators are based on record level MHSDS data for people referred to secondary mental health services (excluding learning disability and autism services) - this is as a proxy (or alternative) SMI population measure. A deceased person is considered to have had SMI if referred to secondary mental health services in the 5 years prior to death.
Standard OHID methodology was followed to calculate DSRs for premature mortality in adults with SMI.
The excess premature mortality indicator measures the difference between premature mortality in the population with SMI and the population who do not have SMI. The indicator is calculated as the difference between these DSRs, divided by the DSR in adults without SMI, expressed as a percentage.
For full details of the methodology used visit NHS Outcomes Framework pages.
Strengths and limitations of study
Strengths of the indicators are that:
-
they can be used to compare between areas in England and with England-wide figures
-
they can be used to compare across time and understand the trend
-
anyone accessing only learning disability and autism (LDA) services is not considered to have SMI
Limitations of the indicators are that:
-
not everyone accessing secondary mental health services has SMI
-
not everyone with SMI accesses secondary mental health services as some people will be managed only by their GP team
-
there may be variation by area in who from the local population accesses secondary mental health services
-
due to poor data quality in mental health data prior to 2009, it was only possible to look back for 5 years before death for evidence of SMI
-
people with SMI may not have been accessing secondary mental health services in the 5 years preceding death and in this indicators set they will not be considered as having SMI
-
premature mortality rates in adults with SMI cannot be directly compared to other indicators premature mortality rates in the general population published in NHS OF and PHOF due to different age definitions (18 to 74 versus all ages under 75)
-
people younger than 18 years of age are not included as it has not been possible to search the mental health data for the full 5 years before death
The quality of mental health services data continues to improve over time. The methodology for the indicators will be re-assessed in the future to consider if we can improve it by using different data sources or a longer time period to identify people with SMI.
Terminology and definitions
Premature mortality
A measure of the number of deaths before the age of 75. The upper age limit aligns these indicators with other measures of premature mortality published by the Office for Health and Disparities (OHID) and other organisations such as the Office for National Statistics (ONS) or NHS England.
Excess premature mortality
A measure of the difference in premature mortality between 2 population groups.
Adults
Defined here as people aged 18 and over at the date of their death. This is further limited to those aged 18 to 74 at the date of their death to define premature mortality in adults. Children and Adolescent Mental Health Services (CAMHS) have only submitted data to the mental health data sets since April 2016.
SMI cohort definition
People who have died were considered to have SMI if they had a referral to secondary mental health services (excluding learning disability and autism services) in the 5 years before they died.
Population with SMI
The population with SMI for a particular year was calculated as everyone with a referral to secondary mental health services in the financial year that began in the year, and the 4 previous financial years. For example, the population with SMI for 2015 was calculated as everyone with a referral to secondary mental health services in the financial years 2014 to 2015, 2013 to 2014, 2012 to 2013, 2011 to 2012 and 2010 to 2011. Each person is only counted once even if they had multiple referrals in multiple years.
Areas of particular interest: detail and data
Using data for the period 2018 to 2020, the below tables list areas identified within each group. For each area the tables also provide information on:
-
premature mortality rates in adults with SMI
-
excess under 75 mortality rates in adults with SMI
-
under 75 mortality rates for all causes in the general population
-
local area deprivation as measured by the index of multiple deprivation (IMD)
-
number of people in contact with secondary mental health services used as proxy for SMI population in premature mortality in adults with SMI indicators
Group 1 - UTLAs with high premature mortality in adults with SMI and also high premature mortality in the population overall
| Area name (region) | Premature mortality adults with SMI - DSR per 100,000 population (quintile group with 1 lowest) | Premature mortality rate from all causes (persons) - DSR per 100,000 population (quintile group with 1 lowest) | Excess premature mortality adults with SMI - index in % (quintile group with 1 lowest) | Estimated SMI/MH population - number (quintile group with 1 lowest) | Deprivation - IMD score (quintile group with 1 lowest) |
|---|---|---|---|---|---|
| Middlesbrough (North East) | 192.7 (5) | 493.9 (5) | 390.3 (3) | 32630 (1) | 40.5 (5) |
| Newcastle upon Tyne (North East) | 135.5 (4) | 423.7 (5) | 345.8 (2) | 55270 (4) | 29.8 (4) |
| Gateshead (North East) | 140 (4) | 421 (5) | 388.2 (3) | 36465 (2) | 28.2 (4) |
| Blackburn with Darwen (North West) | 135.6 (4) | 454.4 (5) | 219.7 (1) | 35185 (2) | 36 (5) |
| Blackpool (North West) | 208.5 (5) | 570.7 (5) | 257.5 (1) | 43505 (2) | 45 (5) |
| Bolton (North West) | 133.9 (4) | 426.7 (5) | 392.9 (3) | 48320 (3) | 30.7 (5) |
| Manchester (North West) | 212.4 (5) | 528.2 (5) | 207 (1) | 149905 (5) | 40 (5) |
| Oldham (North West) | 171 (5) | 450.1 (5) | 293.4 (1) | 57920 (4) | 33.2 (5) |
| Rochdale (North West) | 187.4 (5) | 452.5 (5) | 387.4 (3) | 51680 (3) | 34.4 (5) |
| Salford (North West) | 181.7 (5) | 463.5 (5) | 384.7 (3) | 53225 (3) | 34.2 (5) |
| Tameside (North West) | 148.3 (5) | 446.9 (5) | 337.5 (2) | 49660 (3) | 31.4 (5) |
| Wigan (North West) | 144.9 (5) | 406.8 (4) | 380.7 (3) | 73850 (4) | 25.7 (4) |
| Knowsley (North West) | 175.4 (5) | 494.8 (5) | 306.7 (1) | 36450 (2) | 43 (5) |
| Liverpool (North West) | 190.9 (5) | 497.3 (5) | 333.6 (2) | 121875 (5) | 42.4 (5) |
| St Helens (North West) | 142 (5) | 414.9 (5) | 406.4 (3) | 37445 (2) | 31.5 (5) |
| Wirral (North West) | 129.3 (4) | 405.9 (4) | 419.9 (3) | 59130 (4) | 29.6 (4) |
| Lancashire (North West) | 117.7 (4) | 382.5 (4) | 297 (1) | 270320 (5) | 23.4 (3) |
| Kingston upon Hull (Yorkshire and the Humber) | 180.7 (5) | 488.6 (5) | 154.4 (1) | 122350 (5) | 40.6 (5) |
| Barnsley (Yorkshire and the Humber) | 130 (4) | 409.4 (4) | 318.7 (1) | 53575 (3) | 29.9 (5) |
| Rotherham (Yorkshire and the Humber) | 121.6 (4) | 426 (5) | 382.1 (3) | 44125 (2) | 29.6 (4) |
| Leeds (Yorkshire and the Humber) | 127.4 (4) | 392.9 (4) | 353.6 (2) | 147415 (5) | 27.3 (4) |
| Leicester (East Midlands) | 164.4 (5) | 433.4 (5) | 316.8 (1) | 71450 (4) | 30.9 (5) |
| Nottingham (East Midlands) | 170.7 (5) | 468.4 (5) | 373.6 (2) | 67740 (4) | 34.9 (5) |
| Stoke-on-Trent (West Midlands) | 192.7 (5) | 482 (5) | 354.1 (2) | 62310 (4) | 34.5 (5) |
| Birmingham (West Midlands) | 147.8 (5) | 431.3 (5) | 300.3 (1) | 251465 (5) | 38.1 (5) |
| Sandwell (West Midlands) | 152 (5) | 471.9 (5) | 297.1 (1) | 70555 (4) | 34.9 (5) |
| Wolverhampton (West Midlands) | 115.7 (4) | 444.8 (5) | 262.5 (1) | 47485 (3) | 32.1 (5) |
| Peterborough (East of England) | 126.8 (4) | 375.7 (4) | 360.1 (2) | 41340 (2) | 27.8 (4) |
| Luton (East of England) | 121.7 (4) | 388 (4) | 355.3 (2) | 34560 (2) | 25.9 (4) |
| Barking and Dagenham (London) | 143.4 (5) | 449.3 (5) | 329.4 (1) | 33900 (1) | 32.8 (5) |
| Greenwich (London) | 124.9 (4) | 376.1 (4) | 339.9 (2) | 50670 (3) | 24.5 (3) |
| Newham (London) | 140.2 (4) | 385.2 (4) | 355.7 (2) | 61480 (4) | 29.6 (4) |
| Reading (South East) | 130.4 (4) | 375.4 (4) | 331.4 (1) | 34340 (2) | 19.6 (2) |
| Slough (South East) | 123.1 (4) | 392.8 (4) | 320.1 (1) | 23985 (1) | 23 (3) |
| Torbay (South West) | 117.6 (4) | 374.9 (4) | 374.7 (2) | 29205 (1) | 28.1 (4) |
Group 2 - UTLAs with high premature mortality in adults with SMI and that do not have high premature mortality in the population overall
| Area name (region) | Premature mortality adults with SMI - DSR per 100,000 population (quintile group with 1 lowest) | Premature mortality rate from all causes (persons) - DSR per 100,000 population (quintile group with 1 lowest) | Excess premature mortality adults with SMI - index in % (quintile group with 1 lowest) | Estimated SMI/MH population - number (quintile group with 1 lowest) | Deprivation - IMD score (quintile group with 1 lowest) |
|---|---|---|---|---|---|
| Thurrock (East of England) | 184.1 (5) | 351.9 (3) | 247.7 (1) | 83980 (4) | 20.9 (3) |
| Hackney (London) | 119.1 (4) | 365.5 (3) | 223.3 (1) | 63935 (4) | 32.5 (5) |
| Hammersmith and Fulham (London) | 145.2 (5) | 370 (3) | 393.1 (3) | 36655 (2) | 22.3 (3) |
| Hillingdon (London) | 129.2 (4) | 330.3 (3) | 420.4 (3) | 57890 (4) | 18.2 (2) |
| Islington (London) | 145.2 (5) | 364.2 (3) | 349.7 (2) | 47430 (3) | 27.5 (4) |
| Tower Hamlets (London) | 146.9 (5) | 350.3 (3) | 375.3 (3) | 59610 (4) | 27.9 (4) |
Group 3 - UTLAs with high premature mortality in adults with SMI and also high excess premature mortality in the adults with SMI
| Area name (region) | Premature mortality adults with SMI – DSR per 100,000 population (quintile group with 1 lowest) | Premature mortality rate from all causes (persons) – DSR per 100,000 population (quintile group with 1 lowest) | Excess premature mortality adults with SMI – index in % (quintile group with 1 lowest) | Estimated SMI/MH population – number (quintile group with 1 lowest) | Deprivation – IMD score (quintile group with 1 lowest) |
|---|---|---|---|---|---|
| Hartlepool (North East) | 175.3 (5) | 435.1 (5) | 490.2 (5) | 18990 (1) | 35 (5) |
| Redcar and Cleveland (North East) | 145.7 (5) | 416.2 (5) | 444.9 (4) | 26970 (1) | 29.8 (4) |
| Stockton-on-Tees (North East) | 141.5 (4) | 395.3 (4) | 458.6 (4) | 37945 (2) | 25.8 (4) |
| Darlington (North East) | 140 (4) | 401 (4) | 440.6 (4) | 21920 (1) | 25.7 (4) |
| County Durham (North East) | 148.8 (5) | 401.2 (4) | 480.6 (5) | 107600 (5) | 26.8 (4) |
| North Tyneside (North East) | 120.4 (4) | 366.4 (3) | 542.9 (5) | 35255 (2) | 22.3 (3) |
| South Tyneside (North East) | 172.9 (5) | 450.5 (5) | 491.3 (5) | 27925 (1) | 31.5 (5) |
| Sunderland (North East) | 172.1 (5) | 438.4 (5) | 443.2 (4) | 60495 (4) | 30.6 (5) |
| Bury (North West) | 181 (5) | 382.6 (4) | 452.9 (4) | 51620 (3) | 23.7 (3) |
| Stockport (North West) | 117.8 (4) | 339.3 (3) | 434.7 (4) | 54245 (3) | 20.8 (3) |
| Sefton (North West) | 138.5 (4) | 381.9 (4) | 425 (4) | 54980 (4) | 27 (4) |
| Derby (East Midlands) | 148.4 (5) | 417.3 (5) | 444.2 (4) | 43285 (2) | 26.3 (4) |
| Telford and Wrekin (West Midlands) | 134.4 (4) | 389.5 (4) | 475.4 (5) | 33930 (2) | 25 (3) |
| Lambeth (London) | 138.3 (4) | 379.6 (4) | 456.5 (4) | 44635 (3) | 25.4 (3) |
| Lewisham (London) | 120.2 (4) | 359.9 (3) | 459.2 (4) | 43855 (2) | 26.7 (4) |
| Southwark (London) | 126.7 (4) | 357.6 (3) | 538.3 (5) | 40625 (2) | 25.8 (4) |
| Brighton and Hove (South East) | 120.1 (4) | 349.6 (3) | 433.7 (4) | 58380 (4) | 20.8 (3) |
| Isle of Wight (South East) | 117.8 (4) | 325.9 (2) | 458.3 (4) | 27015 (1) | 23.3 (3) |
| Bristol (South West) | 127.8 (4) | 377.2 (4) | 472.1 (5) | 76945 (4) | 26.4 (4) |
Group 4 - UTLAs with high excess premature mortality in adults with SMI but not high premature mortality in adults with SMI
| Area name (region) | Premature mortality adults with SMI – DSR per 100,000 population (quintile group with 1 lowest) | Premature mortality rate from all causes (persons) – DSR per 100,000 population (quintile group with 1 lowest) | Excess premature mortality adults with SMI – index in % (quintile group with 1 lowest) | Estimated SMI/MH population – number (quintile group with 1 lowest) | Deprivation – IMD score (quintile group with 1 lowest) |
|---|---|---|---|---|---|
| Northumberland (North East) | 105.6 (3) | 330 (2) | 501.6 (5) | 49620 (3) | 22.1 (3) |
| Warrington (North West) | 111.3 (3) | 347.6 (3) | 464.9 (4) | 35305 (2) | 18.9 (2) |
| Cheshire East (North West) | 80.3 (1) | 298.1 (2) | 504 (5) | 45330 (3) | 14.5 (1) |
| Cheshire West and Chester (North West) | 87.7 (2) | 329.3 (2) | 506.4 (5) | 38725 (2) | 18.1 (2) |
| Trafford (North West) | 104.4 (3) | 306.8 (2) | 454.7 (4) | 36695 (2) | 16.1 (2) |
| Cumbria (North West) | 108.7 (3) | 339.4 (3) | 468.9 (5) | 80215 (4) | 21.3 (3) |
| York (Yorkshire and the Humber) | 94.9 (2) | 321.4 (2) | 425.3 (4) | 34755 (2) | 11.7 (1) |
| North Yorkshire (Yorkshire and the Humber) | 87.2 (2) | 289.1 (1) | 439 (4) | 101415 (5) | 14.8 (1) |
| Rutland (East Midlands) | 55.9 (1) | 221 (1) | 445.8 (4) | 4835 (1) | 8.4 (1) |
| Derbyshire (East Midlands) | 101.9 (3) | 333.6 (3) | 444.8 (4) | 123485 (5) | 18.4 (2) |
| Leicestershire (East Midlands) | 95.2 (2) | 292.3 (1) | 493 (5) | 105730 (5) | 12.3 (1) |
| Lincolnshire (East Midlands) | 110.6 (3) | 343.3 (3) | 436.8 (4) | 125300 (5) | 20.3 (3) |
| Nottinghamshire (East Midlands) | 94.6 (2) | 332.6 (3) | 438.1 (4) | 123330 (5) | 19 (2) |
| Shropshire (West Midlands) | 89 (2) | 296.5 (2) | 477.6 (5) | 48510 (3) | 17.2 (2) |
| Solihull (West Midlands) | 101 (3) | 296.7 (2) | 466 (5) | 38270 (2) | 17.4 (2) |
| Staffordshire (West Midlands) | 103.8 (3) | 330.2 (3) | 436.3 (4) | 145405 (5) | 16.6 (2) |
| Bedford (East of England) | 111 (3) | 335.3 (3) | 426.1 (4) | 30115 (1) | 18.9 (2) |
| Central Bedfordshire (East of England) | 81.1 (1) | 298.5 (2) | 471.5 (5) | 39000 (2) | 12.2 (1) |
| Cambridgeshire (East of England) | 91.7 (2) | 278.7 (1) | 494.4 (5) | 107985 (5) | 13.9 (1) |
| Bromley (London) | 87 (2) | 268.2 (1) | 468.9 (5) | 48455 (3) | 14.2 (1) |
| Camden (London) | 112.5 (3) | 278.6 (1) | 449.4 (4) | 50200 (3) | 20.1 (2) |
| Croydon (London) | 96.2 (2) | 333.9 (3) | 520.6 (5) | 46375 (3) | 22.5 (3) |
| Kensington and Chelsea (London) | 90.9 (2) | 233.2 (1) | 434.7 (4) | 32615 (1) | 21.5 (3) |
| Kingston upon Thames (London) | 80.5 (1) | 261.2 (1) | 544.7 (5) | 21390 (1) | 11.4 (1) |
| Richmond upon Thames (London) | 62.8 (1) | 236.3 (1) | 446.3 (4) | 23950 (1) | 9.4 (1) |
| Sutton (London) | 85.7 (2) | 299.7 (2) | 504.8 (5) | 23380 (1) | 14 (1) |
| Bracknell Forest (South East) | 74.9 (1) | 273.7 (1) | 439.2 (4) | 18275 (1) | 10.2 (1) |
| West Berkshire (South East) | 88.1 (2) | 264.2 (1) | 518.3 (5) | 25655 (1) | 10 (1) |
| Wokingham (South East) | 79.6 (1) | 241.1 (1) | 549.6 (5) | 23200 (1) | 5.8 (1) |
| East Sussex (South East) | 92.1 (2) | 306.5 (2) | 424.1 (4) | 96110 (5) | 19.8 (2) |
| Hampshire (South East) | 70.3 (1) | 265.9 (1) | 485.1 (5) | 175795 (5) | 12.7 (1) |
| Surrey (South East) | 73.4 (1) | 254 (1) | 523.7 (5) | 150630 (5) | 10.1 (1) |
| Bath and North East Somerset (South West) | 76.3 (1) | 270.1 (1) | 615.1 (5) | 25025 (1) | 11.7 (1) |
| North Somerset (South West) | 76.4 (1) | 283.9 (1) | 469.6 (5) | 28485 (1) | 15.8 (2) |
| South Gloucestershire (South West) | 60.2 (1) | 267.4 (1) | 469 (5) | 30575 (1) | 11.7 (1) |
| Swindon (South West) | 89 (2) | 317.8 (2) | 445.9 (4) | 31530 (1) | 18.6 (2) |
| Cornwall (South West) | 83.8 (1) | 308.1 (2) | 445.8 (4) | 83630 (4) | 23.1 (3) |
| Wiltshire (South West) | 67.7 (1) | 271.4 (1) | 529.1 (5) | 63235 (4) | 13.4 (1) |
| Devon (South West) | 81 (1) | 278 (1) | 437.2 (4) | 134445 (5) | 16.6 (2) |
| Gloucestershire (South West) | 84.3 (2) | 300.2 (2) | 580.2 (5) | 69705 (4) | 14.9 (1) |
| Somerset (South West) | 89.2 (2) | 289.2 (1) | 490 (5) | 85325 (5) | 18.6 (2) |
Authors
This report was produced and authored by the National Mental Health Intelligence Network. There was particular input from Cam Lugton, Carrie Pailthorpe, Gabriele Price, Julia Verne, Stephanie Webb, with support from Arvinder Kaur Duggal, Katie Dowden, Alex Nesbitt and Sue Foster.
Acknowledgements
We are particularly thankful for the contributions from Allan Baker, Alison Brabban, Alan Cohen, Carl Child, David Fisher, Pam Freeman, Paul Fryers, Helen Garnham, Joseph Hayes, Sarah Holloway, Alison Hooper, Misha Imtiaz, Sally Jones, David Keighley, David Kingdon, Alexandra Lazaro, Beth McGeever, Athira Manoharan, David Osborn, Giovanna Polato, Leila Reyburn, Lucy Schonegevel, Emma Tiffin, Walt Treloar, Mark Wagner, Matt Wickenden and Annabel Yadoo.
This report has been co-funded by NHS England.