The Timpson Review into exclusions is finally published today.
In this blogpost, we’re going to examine the odds of exclusion for black Caribbean and mixed white/black Caribbean pupils during Years 7 to 11, based on some analysis that we carried out for the review.
We’ll discuss some of the other findings and recommendations in subsequent posts.
The odds of exclusion
We previously looked at the links between exclusion, placement in state alternative provision and leaving the roll of a mainstream school in this blogpost. Here, we looked at the cohort which started Year 7 in September 2010, who will generally have completed their secondary education in 2015.
As the Timpson Review does, we found that some groups of pupils were more likely to face permanent exclusion.
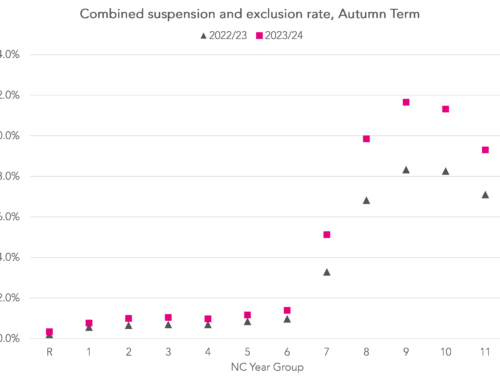
Subsequent cohorts have been affected by increasing rates of exclusion.
In this blogpost, we’ll look at the cohort which began Year 7 in September 2012 and track them to the end of Key Stage 4 in summer 2017. This is the latest cohort for which a full set of exclusions data is available.
We’ll look at three outcomes:
- permanent exclusion between Year 7 and Year 11;
- fixed-term exclusion between Year 7 and Year 11;
- a high rate of fixed term exclusion between Year 7 and Year 11, defined as at least five fixed-term exclusions or fixed-term exclusions totalling at least 20 days in duration
At a high-level, black Caribbean and mixed white/black Caribbean pupils were three times more likely to be permanently excluded and more than twice as likely to face fixed term exclusion as other pupils, as the chart below shows. (We should acknowledge that Gypsy/Roma and Irish heritage Traveller pupils are also far more likely to face exclusion than other pupils).

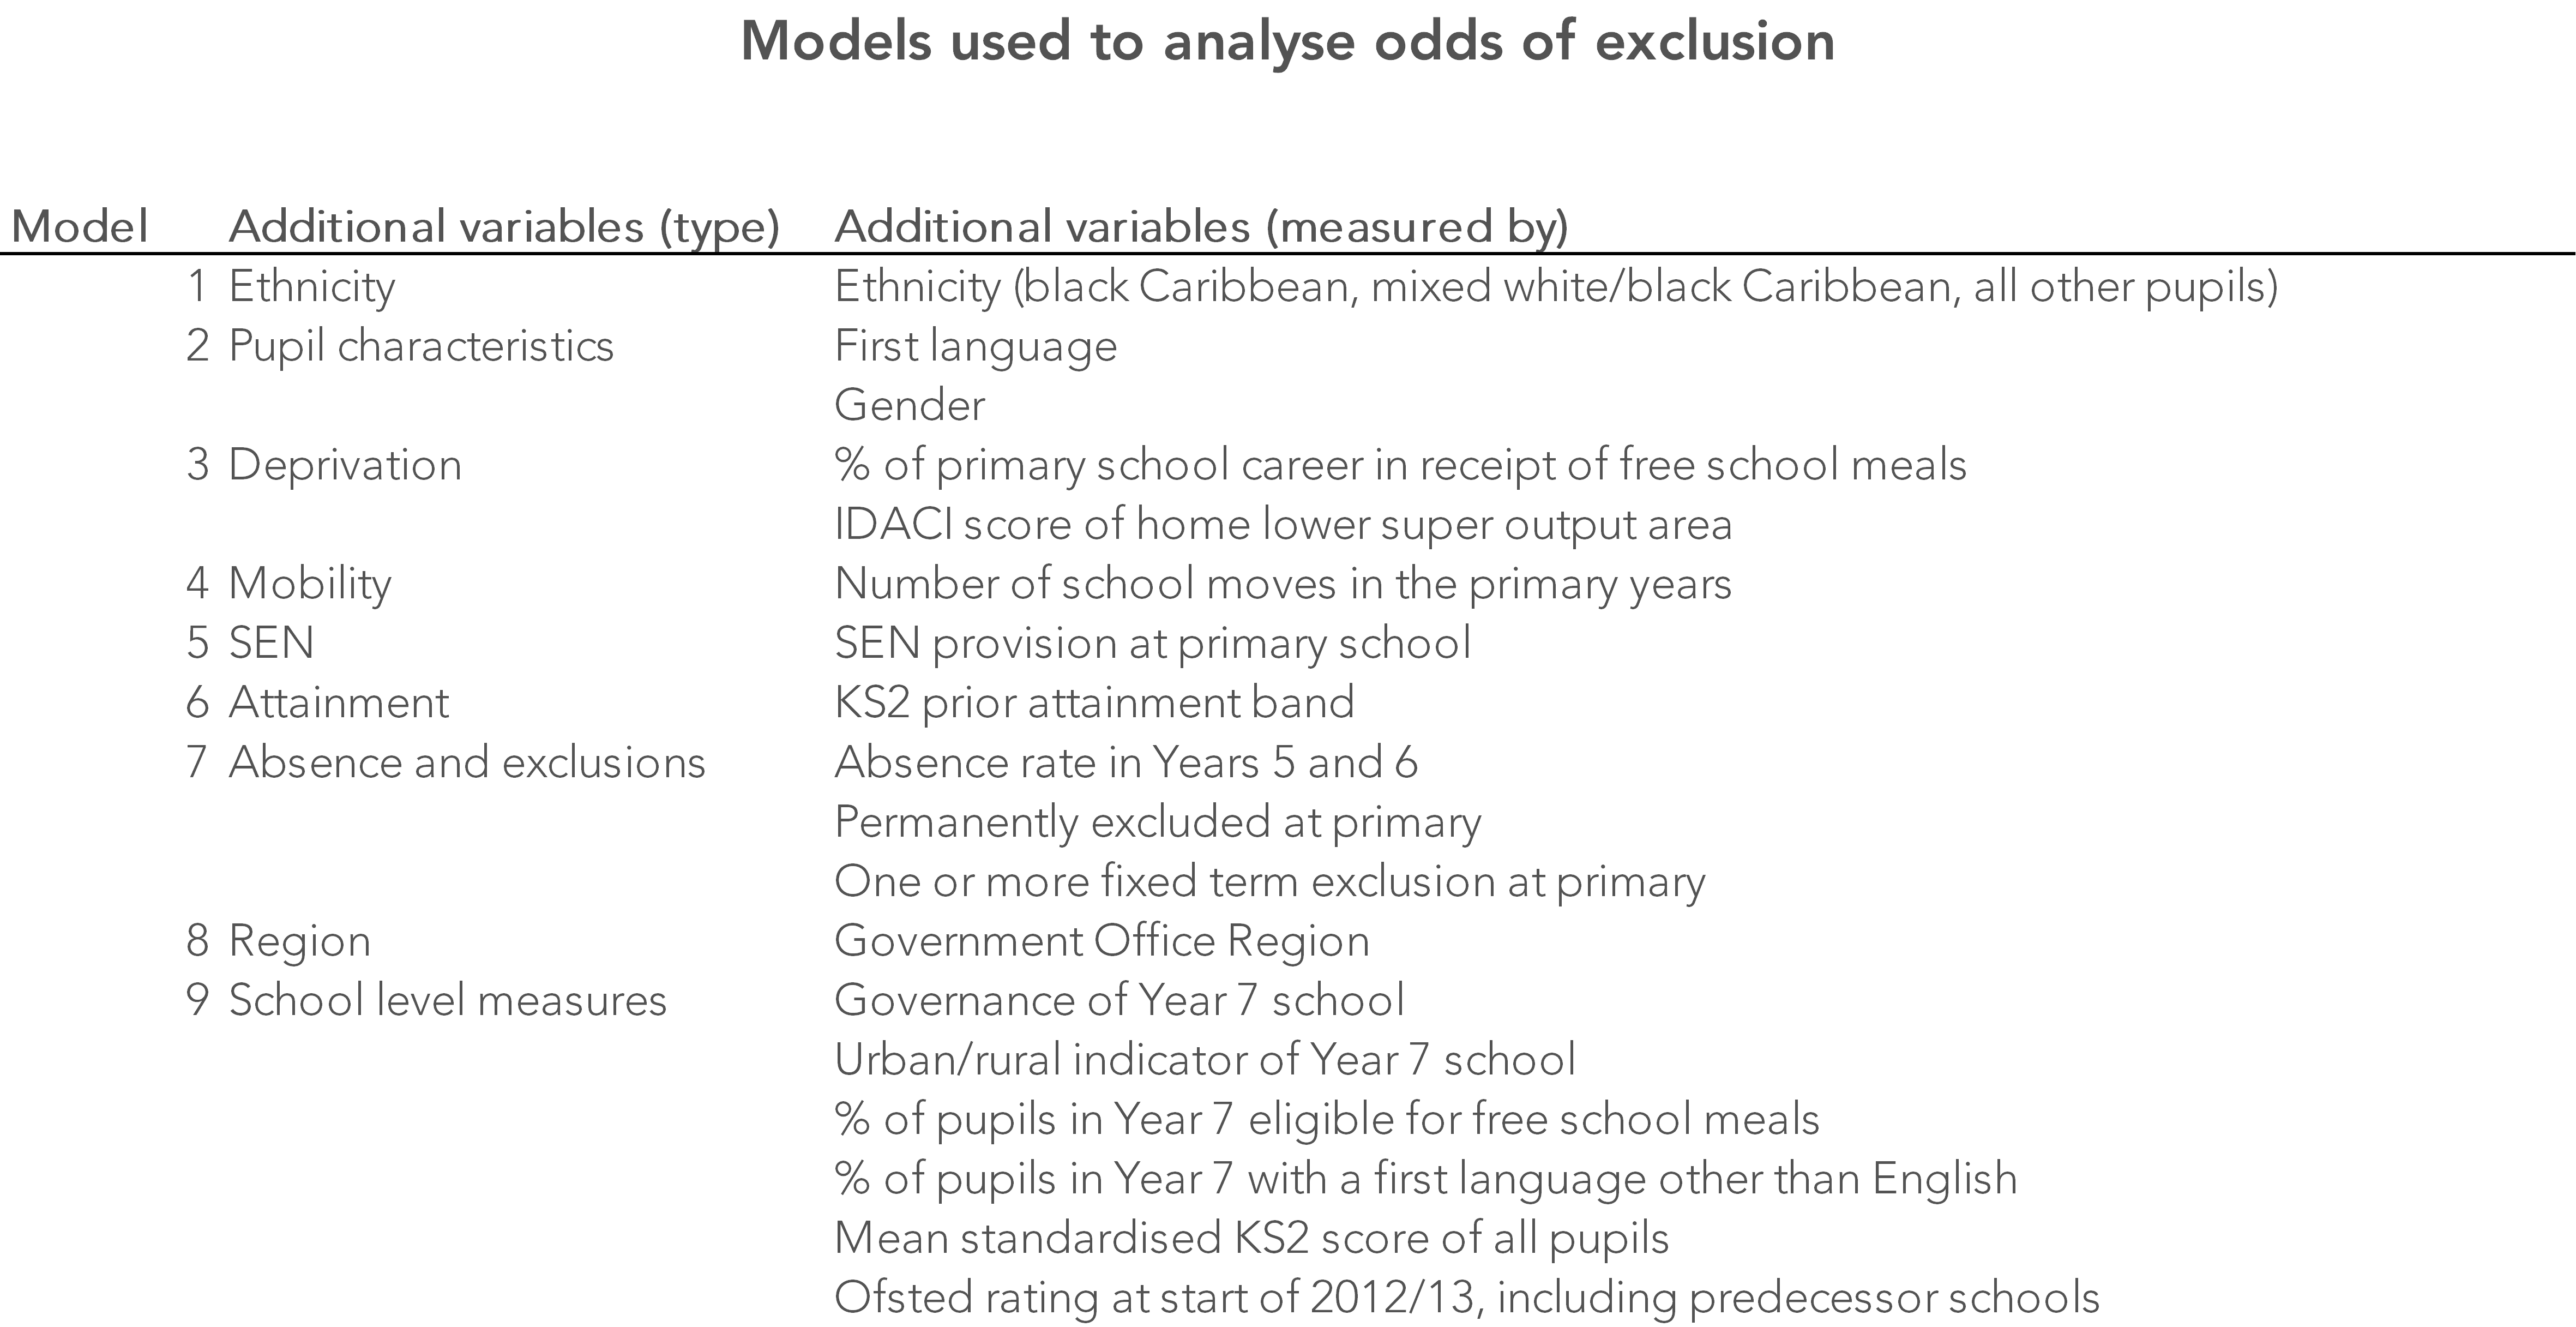
To dig more deeply, we can compare the odds of exclusion separately for black Caribbean and mixed white/black Caribbean pupils to those of all other pupils, controlling for a range of factors. (For those who were interested, a table setting out the details of this be found here).
Odds ratios
The probability of a black Caribbean pupil experiencing a permanent exclusion before the end of Year 11 was 2.6%, and the probability of not being permanently excluded was 97.4%.
The odds of being permanently excluded were therefore 2.6/97.4 = 0.027 to three decimal places.
Similarly, the probability of all other pupils experiencing a permanent exclusion was 0.8% and the probability of not experiencing a permanent exclusion was 99.2%. The odds of being permanently excluded were therefore 0.008 to three decimal places.
The odds ratio between the two groups is 0.027/0.008 = 3.197 (when using unrounded odds).
Because the events we are looking at this in this blogpost are relatively rare, we can say that black Caribbean pupils were approximately 3.2 times more likely to be permanently excluded than other pupils.
However, the odds ratio only has this straightforward interpretation if the event being analysed is relatively rare.
The tables show the results of this separately for black Caribbean pupils and mixed white/black Caribbean pupils. In each case, we’re looking at a population of around 7,400 pupils.
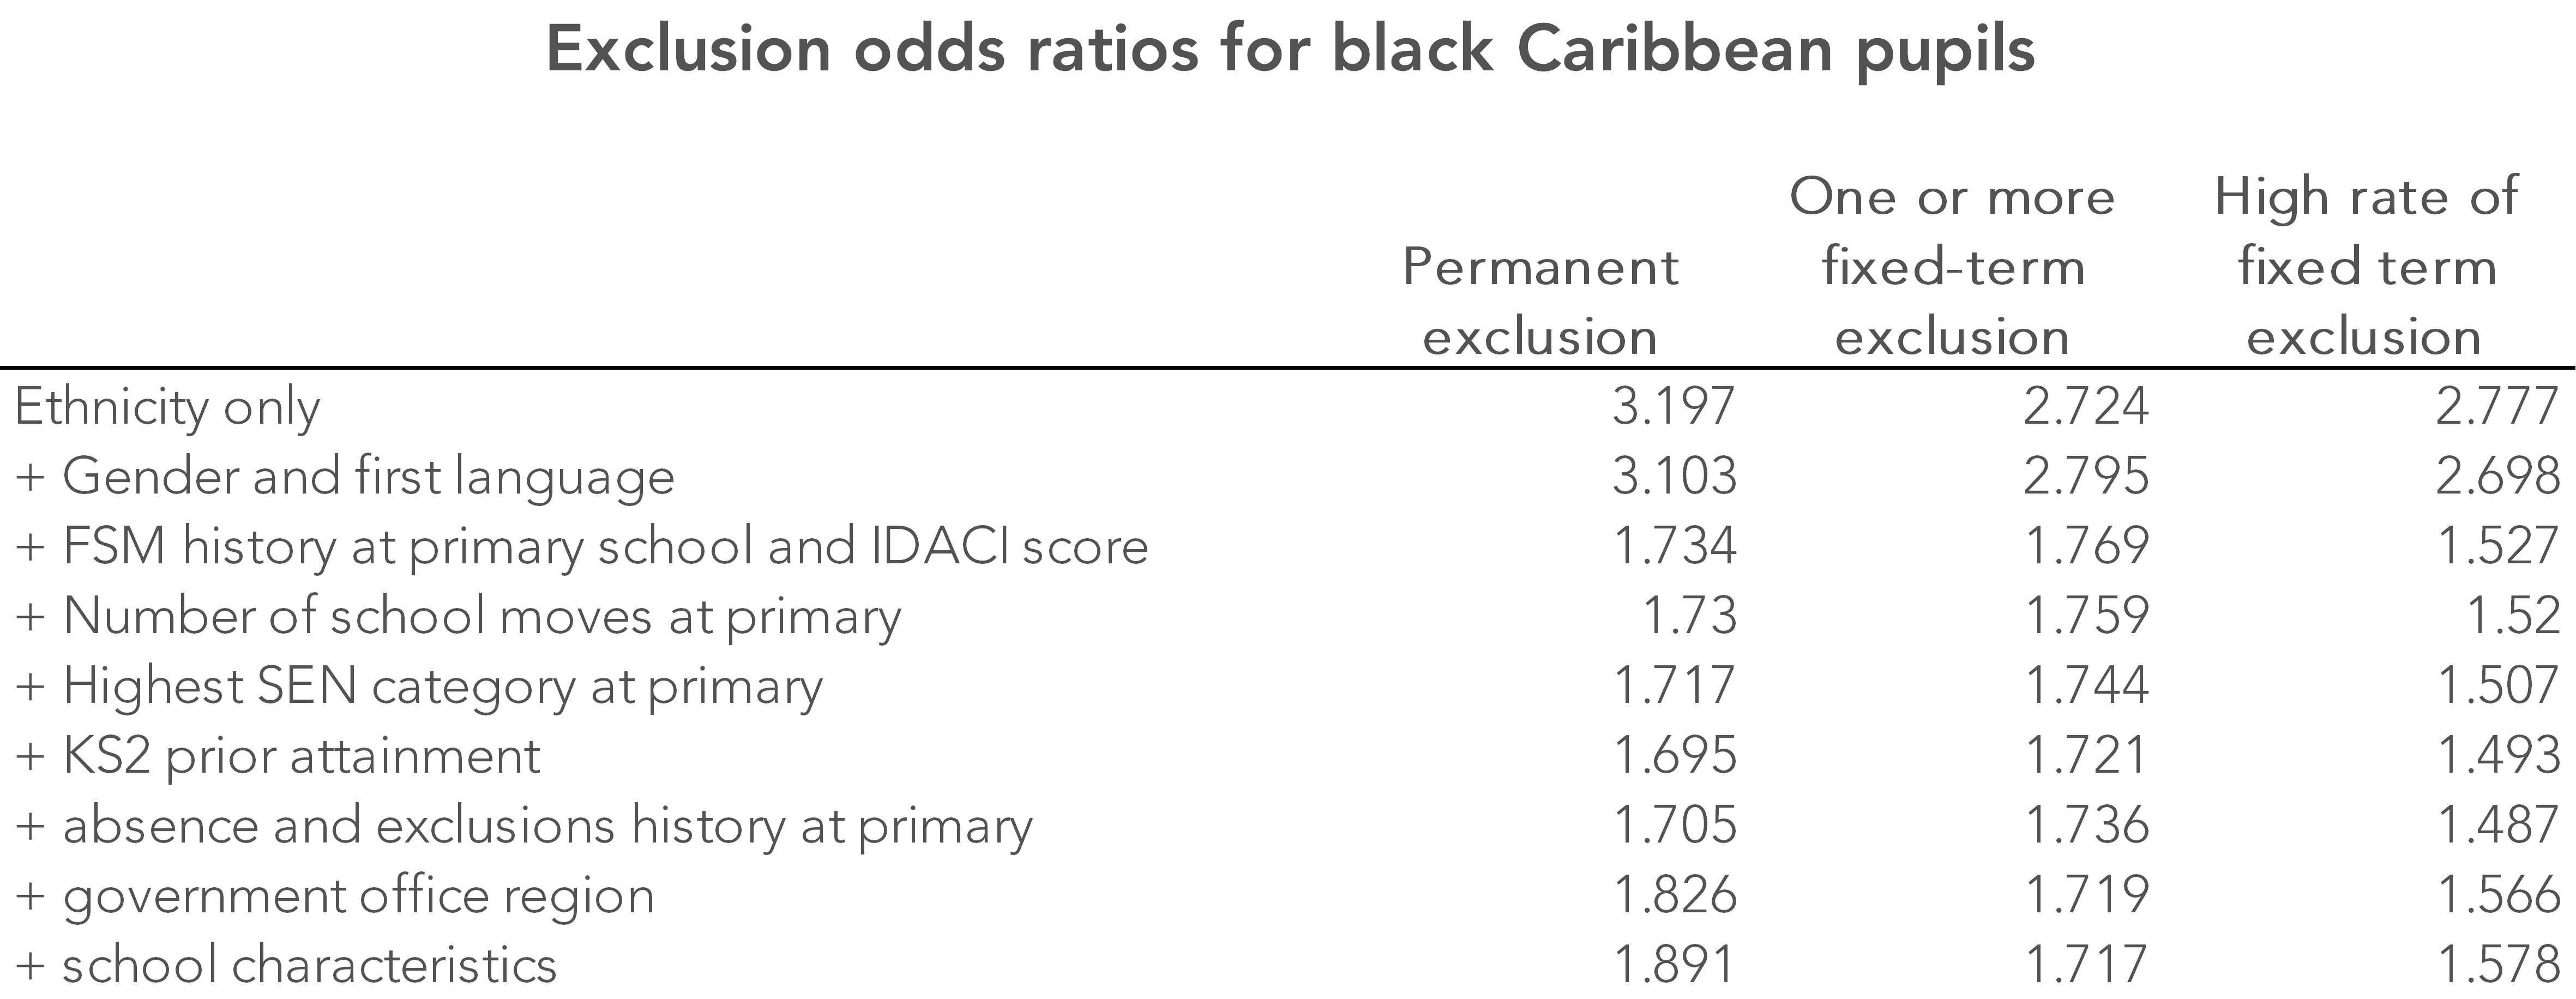
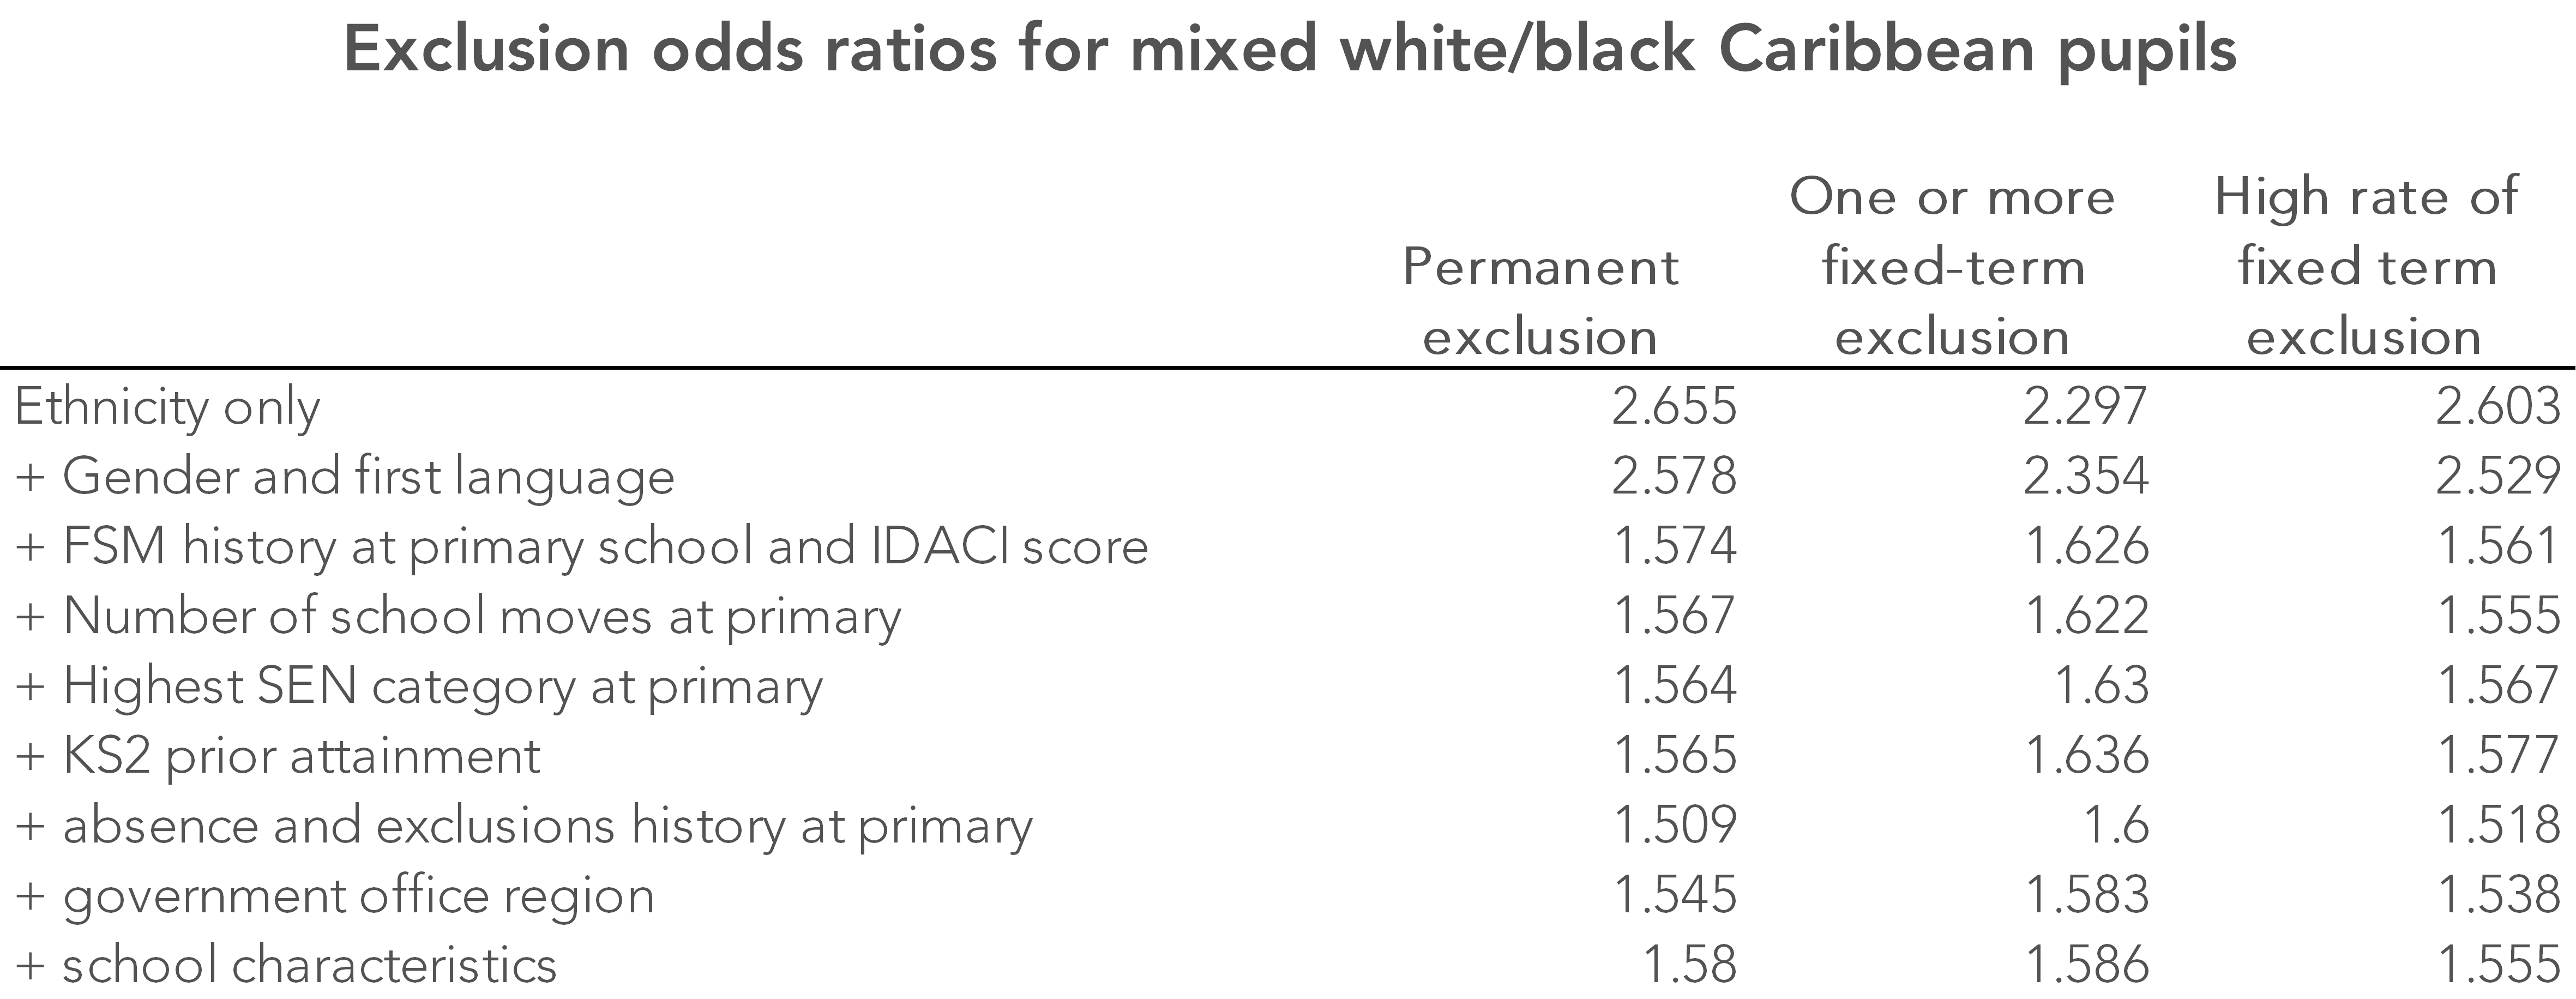
The odds of all three exclusion outcomes for both black Caribbean pupils and mixed white/black Caribbean pupils reduce when other confounding factors are controlled for, particularly measures of disadvantage. However, they remain higher than for other pupils by a factor of 1.5 to 1.9.
Of course, none of this takes account of what happens to pupils during their secondary years or what happens to them out of school.
It is also the case that most black Caribbean pupils won’t be excluded.
However, it does seem that the odds are stacked against them.
Want to stay up-to-date with the latest research from FFT Education Datalab? Sign up to Datalab’s mailing list to get notifications about new blogposts, or to receive the team’s half-termly newsletter.


The big question this raises is whether schools are stacking things against pupils with Caribbean heritage or whether it is life in general that is doing so. Are schools (consciously or unconsciously) biased against them, and more likely to exclude them than pupils of different ethnicities for similar patterns of behaviour? Or is it that those pupils are more likely to display behaviours that get pupils excluded, and that they are ‘earning’ the disproportionately high exclusion rate? And if that’s the case, why do these pupils behave worse than others, even after correcting for a range of contextual factors, and what can we do differently in schools and society at large to support them better?
What impact does structural racism have on the higher exclusion rate of Black Caribbean children?
Hi. Not sure is the honest answer.