Determining drivers of phytoplankton carbon to chlorophyll ratio at Atlantic Basin scale
 Timothy Smyth
 David Moffat
 Glen Tarran
 Shubha Sathyendranath
 Francois Ribalet
 John Casey
- 1Plymouth Marine Laboratory, Prospect Place, Plymouth, Devon, United Kingdom
- 2School of Oceanography, Center for Environmental Genomics, University of Washington, Seattle, WA, United States
- 3Department of Earth, Atmosphere and Planetary Sciences, Massachusetts Institute of Technology, Cambridge, MA, United States
- 4Daniel K. Inouye Center for Microbial Oceanography, School of Ocean and Earth Science and Technology, University of Hawai’i, Mānoa, Honolulu, HI, United States
- 5Lawrence Livermore National Laboratory, Bioscience and Biotechnology Division, Livermore, CA, United States
We demonstrate the ability of flow cytometry to determine species specific cellular carbon and chlorophyll content in vivo by using laboratory cultures of phytoplankton encompassing a wide range of cell sizes. When applied to the large Atlantic Meridional Transect flow cytometry dataset, we reveal patterns in the species-specific phytoplankton carbon (C), chlorophyll (Chl) and C:Chl ratio. For Prochlorococcus the range of C:Chl is between 2 – 604; for Synechococcus 0.5 – 558. Using a Random Forest machine learning approach, we show that predictability of phytoplankton C:Chl, dominated by the prevalence of Prochlorococcus, is largely driven by silicate and nitrite concentration in the Atlantic Ocean.
Introduction
The ocean’s soft tissue carbon pump (Volk and Hoffert, 1985) removes atmospheric CO2 through particle sinking and is governed by the balance of photosynthesis and respiration, abiotic factors such as temperature (Geider, 1987), and biogeochemical factors such as elemental stoichiometry (Collos et al., 1999). The phytoplankton carbon-to-chlorophyll-a ratio (C:Chl) is a key parameter determining photosynthetic rate (Jassby and Platt, 1976) and is widely applied in biogeochemical modeling (Behrenfeld et al., 2005) and for the quantification of phytoplankton biomass (Riemann et al., 1989; Jakobsen and Markager, 2016).
Plankton cellular C content is closely related to cell volume (Menden-Deuer and Lessard, 2000) and is therefore likely to be strongly correlated with a cell’s light scattering characteristics. Phytoplankton cells are of a size (0.5 – 20 µm) relative to visible light (400 – 700 nm) which means they scatter in the Mie regime (Mie, 1908); the scattering phase function (i.e., the directionality of the scattered photons) is determined by the cell’s size and refractive index (e.g., Bohren and Huffman (1983)). Flow cytometry is a proven tool in marine biology for discriminating and enumerating the smallest phytoplankton cells based on their light (forward and side) scattering and fluorescence (red, orange, green) signatures (Tarran et al., 2006) and has been previously used to determine cell size and refractive index (Ackleson and Spinrad, 1988; Green et al., 2003; Agagliate et al., 2018; Smyth et al., 2019), as well as C quotas (Garrison et al., 2000; DuRand et al., 2001; Shalapyonok et al., 2001; Landry and Kirchman, 2002; Worden et al., 2004; Grob et al., 2007; Casey et al., 2013).
In this paper laboratory phytoplankton cultures were used to estimate C quotas based on forward scatter, and chlorophyll based on side scatter. These laboratory derived relationships were then applied to a large flow cytometry time-series dataset (Smyth et al., 2019) constructed using multiple expeditions of the Atlantic Meridional Transect (AMT) (Rees et al., 2017). The nature of the AMT long-term time-series of expeditions (Rees et al., 2017) ensures that there are multiple sources of contextual (or meta) data available for each transect (Smyth et al., 2017) across multiple ocean provinces (Longhurst et al., 1995).
This work makes the following significant advances in that it:
(1) Reveals a robust relationship between flow-cytometrically measured forward scatter and phytoplankton cellular C content which is replicated on multiple instruments and is log-linear across two orders of magnitude in scatter and five orders of magnitude in C content, i.e., across several phytoplankton size classes.
(2) Reveals a similarly robust relationship between flow-cytometrically measured side scatter and phytoplankton (normalized) fluorescence (nFl) which is replicated on multiple instruments and is log-linear across four orders of magnitude in scatter and four orders of magnitude in nFl.
(3) Quantifies the depth resolved C and Chl content of different phytoplankton populations over multiple AMT expeditions throughout the length of the Atlantic Basin, over multiple ocean provinces.
(4) Determines the dominant drivers of C:Chl through the multiple Atlantic Ocean provinces using Machine Learning approaches.
Materials and methods
Flow cytometry measures the light scatter (forward and side) and fluorescence characteristics of a population of cells or particles on an individual basis by injecting fluid (seawater)-suspended samples, ideally flowing one cell at a time, through a laser beam. A combination of fluorescence (typically: green, orange and red) and side scatter properties are used to further classify the phytoplankton cells into different types and hence enumerate abundances (Tarran et al., 2006). Previous work (Ackleson and Spinrad, 1988; Green et al., 2003; Agagliate et al., 2018; Smyth et al., 2019) has shown that well characterized instruments can determine the size and refractive index of individual phytoplankton cells and populations by measuring their differential forward (dCsca/dΩ3) and side (dCsca/dΩ4) scatter (Bohren and Huffman, 1983) using equations for a detector i of form:
where S(i) is channel value, I(i) laser intensity, G(i) the detector gain, subscript r is a reference particle of known size and refractive index, for each particle p (here phytoplankton cell) of interest. In this work we relate dCsca/dΩ3 and dCsca/dΩ4 to cellular carbon and chlorophyll content.
Laboratory cultures
Average cellular carbon quotas (Ribalet et al., 2019) were determined for six axenic, exponentially growing cyanobacteria cultures (Prochlorococcus MED4, MIT9312, AS9601 and NATL12A, Synechococcus WH7803 and WH8012) and four different eukaryotic phytoplankton cultures (Micromonas pusilla, Navicula transitans, T. pseudonana 3367 and 1135) (Table 1). Cells were grown under continuous light (150 µmol quanta m-2 s-1) in nutrient replete media (Pro99 (Moore et al., 2007) and F/2 media (Guillard et al., 1975) for cyanobacteria and eukaryote species, respectively) and harvested during late exponential phase. Cells were filtered onto pre-combusted 0.3 μm GF-75 or 0.7 μm GF/F filters and analyzed on a Carlo Erba CHNS analyzer (model NA1500) in the Oregon State University Stable Isotope Laboratory using cystine (29.99% carbon and 11.66% nitrogen by weight) as an analytical standard. For each culture, aliquots of growth media filtered through three pre-combusted GF-75 and GF/F glass fiber filters were used as blanks to correct for background carbon concentration on filters before filtration and DOC adsorption onto filters. Carbon quotas were obtained by normalizing the concentrations of blank-corrected particulate carbon to cell abundance measured with a BD Influx cell sorter (Ribalet et al., 2019).
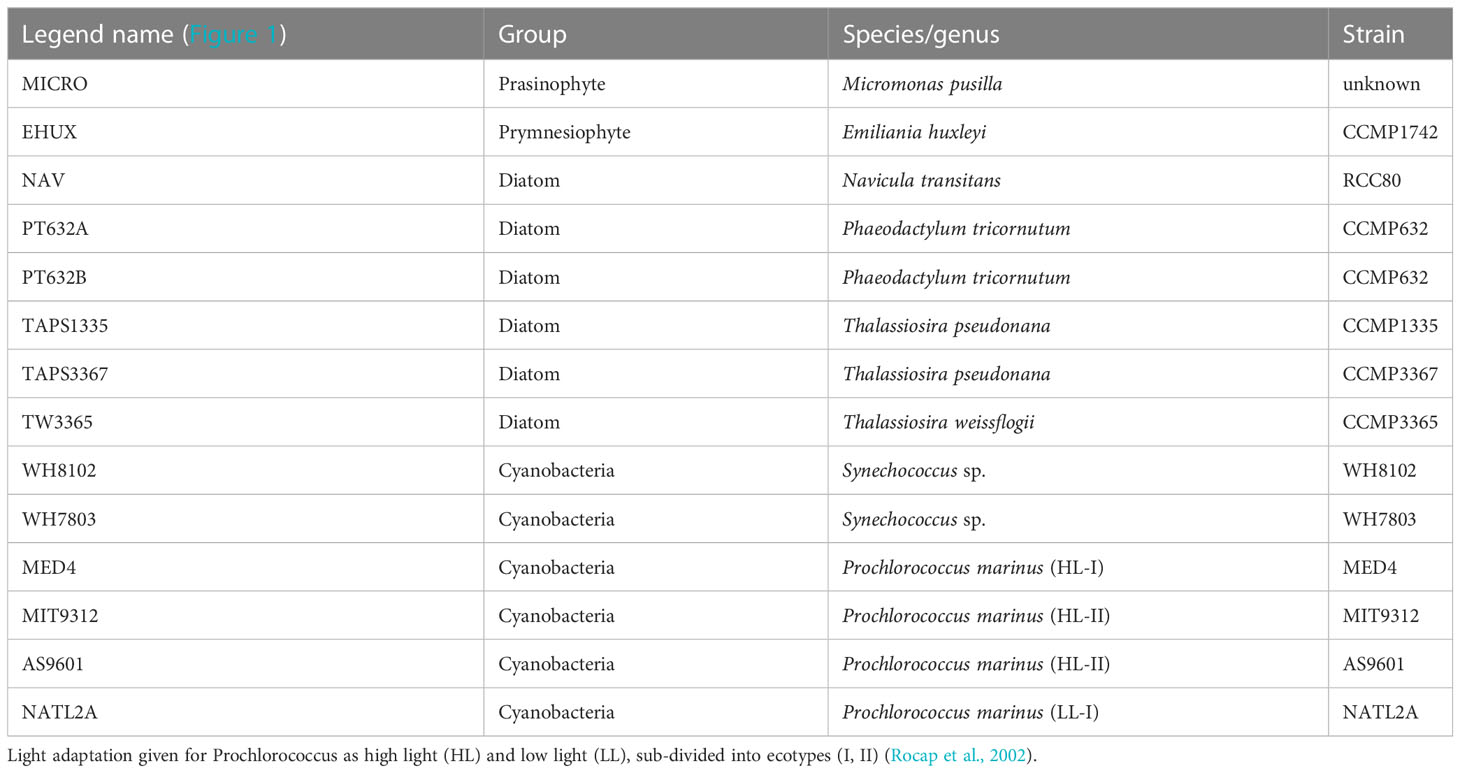
Table 1 Phytoplankton cultures used to derive scattering relationships shown in Figure 1.
nFl was estimated using the log amplified median values of red fluorescence measured by flow cytometry (692 ± 40 nm band-pass filter), normalized to the median values of log amplified 1 µm calibration beads (Invitrogen F8823). Regression analyses were performed between forward scattering and cellular carbon content and between side scattering and nFl (Table 2).
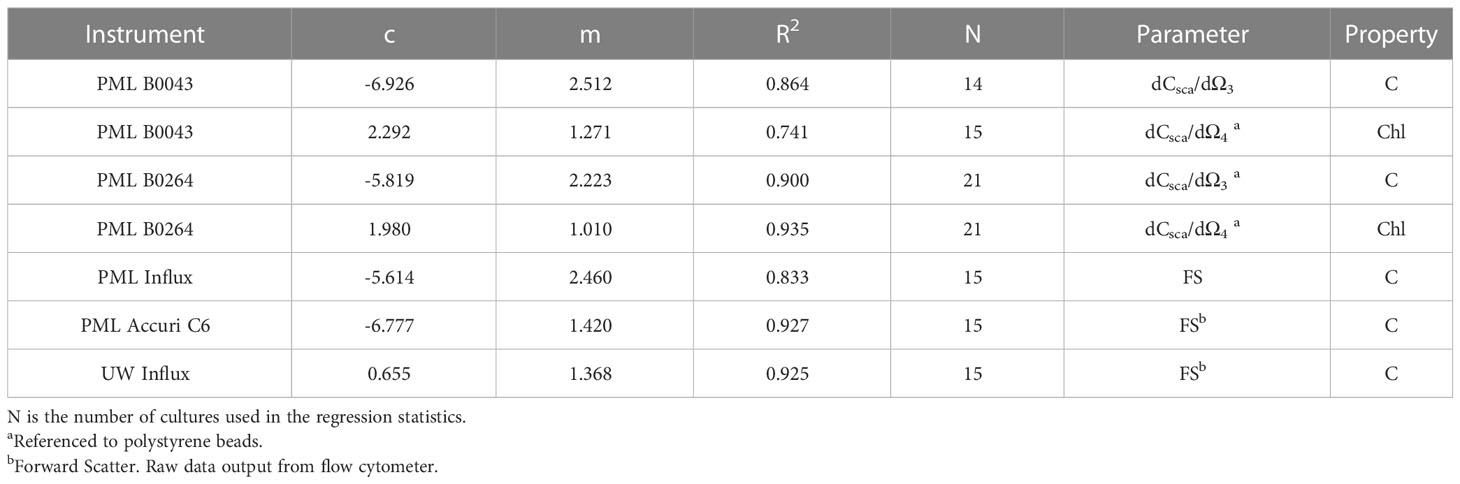
Table 2 Regression statistics for five flow cytometers using the laboratory cultures shown in Table 1 and Figure 2 in log10 space to use with equation of form 10c(dCsca/dΩn)m or 10c(FS)m.
The samples were then preserved (0.25% Glutaraldehyde, 0.01% Pluronic F68 final concentrations (Marie et al., 2014)) and transported to the Plymouth Marine Laboratory so that an independent analysis of flow cytometer scattering could be carried out, and to test for the applicability and subsequent transferability of our methodology.
In situ AMT samples
Two Becton Dickinson FACSort™ flow cytometers (serial numbers B0264 and B0043), with identical optical geometries, were used to enumerate depth-resolved vertical profiles of pico- and nano-phytoplankton for multiple AMT expeditions (AMT18 – 29). The individual samples were collected from Niskin bottles attached to an oceanographic rosette sampler into clean 250 mL polycarbonate bottles (Nalge Nunc International, USA) at multiple depths between the surface and 200 m. These were then stored at 4°C in the dark and analysed within two hours of sample collection. Samples were analysed at flow rates calibrated daily using Beckman Coulter™ Flowset™ fluorospheres (polystyrene) of known concentration, prior to the analysis of seawater samples. The polystyrene beads of known refractive index, used within the flow rate calibration, are critical for maintaining the consistency of the FACS forward and side scattering calibration and give the reference values (subscript r terms) necessary to implement Equation 1.
The FACS uses an air-cooled argon-ion 15 mW laser (488 nm) light source with detectors arranged to measure forward scatter (ψS3= ± 1.5-12.2°) and side scatter (ψS4 = 64-116°); red (>650 nm; note the slightly different but overlapping (692 ± 42 nm) configuration to the laboratory culture flow cytometer) and orange (585 ± 21 nm) fluorescence. For individual samples, cluster analyses were carried out (Smyth et al., 2019) to enumerate abundance and mean values of dCsca/dΩ3 and dCsca/dΩ4. Using differential scatter (side and forward) calibrated against polystyrene beads, enables correction for any change in gain settings the individual flow cytometer operator may have used, for example to enhance manually gated species identification, and ensures continuity between multiple expeditions. The main phytoplankton types analysed were Prochlorococcus and Synechococcus; a generic Other phytoplankton type was also enumerated (see Smyth et al. (2019) and Tarran et al. (2006) for details). On the AMT expedition, the FACS operator typically analyses samples using two gain settings: Pico and Nano [see Table 1, Smyth et al. (2019)]. The Pico setting is used for detecting the smallest phytoplankton sizes (Prochlorococcus and Synechococcus; typically 0.5 – 2 µm) whereas the Nano for slightly larger sizes (> 2 µm; Other). The Pico gain setting is an order of magnitude higher (1 cf. 0.1) than Nano, and also the photomultiplier tube voltages are higher. The regressions determined for the laboratory cultured cells were then applied to the large (33 k samples) AMT FACS dataset.
For each discrete in situ sample the weight of carbon and the concentration of chlorophyll attributable to Prochlorococcus, Synechococcus and Other was calculated using the five stages shown schematically in Figure 2. Stage 1: the cluster analyses described in Smyth et al. (2019) were used to group the phytoplankton into Prochlorococcus (Pro.), Synechococcus (Syn.) and Other (Oth.) populations, the results of which (Stage 2) gave a triplet of measurements for abundance (N), mean dCsca/dΩ3 and mean dCsca/dΩ4. Stage 3: the flow cytometer dependent statistical fits to the logarithmic regressions for cultured cells (Figure 1; Table 2) were applied to the mean dCsca/dΩ3 and mean dCsca/dΩ4 to determine the weight of carbon per cell (pgC cell-1) and nFl respectively. The total weight of carbon for each type was calculated using the abundance (cells m-3) multiplied by the weight of carbon per cell to give mgC m-3 for Cpro, Csyn and Coth. For chlorophyll, two further stages were required. Stage 4: weighting functions for abundance and normalized fluorescence were constructed based on the percentage contribution to the whole for both those parameters for each type. Stage 5: the two weighting functions were multiplied together and then multiplied by the coincidentally measured (using the rosette sampler) fluorometrically derived chlorophyll concentration (Welschmeyer, 1994) for each type. This resulted in Chlpro, Chlsyn and Chloth in units of mgChl m-3.
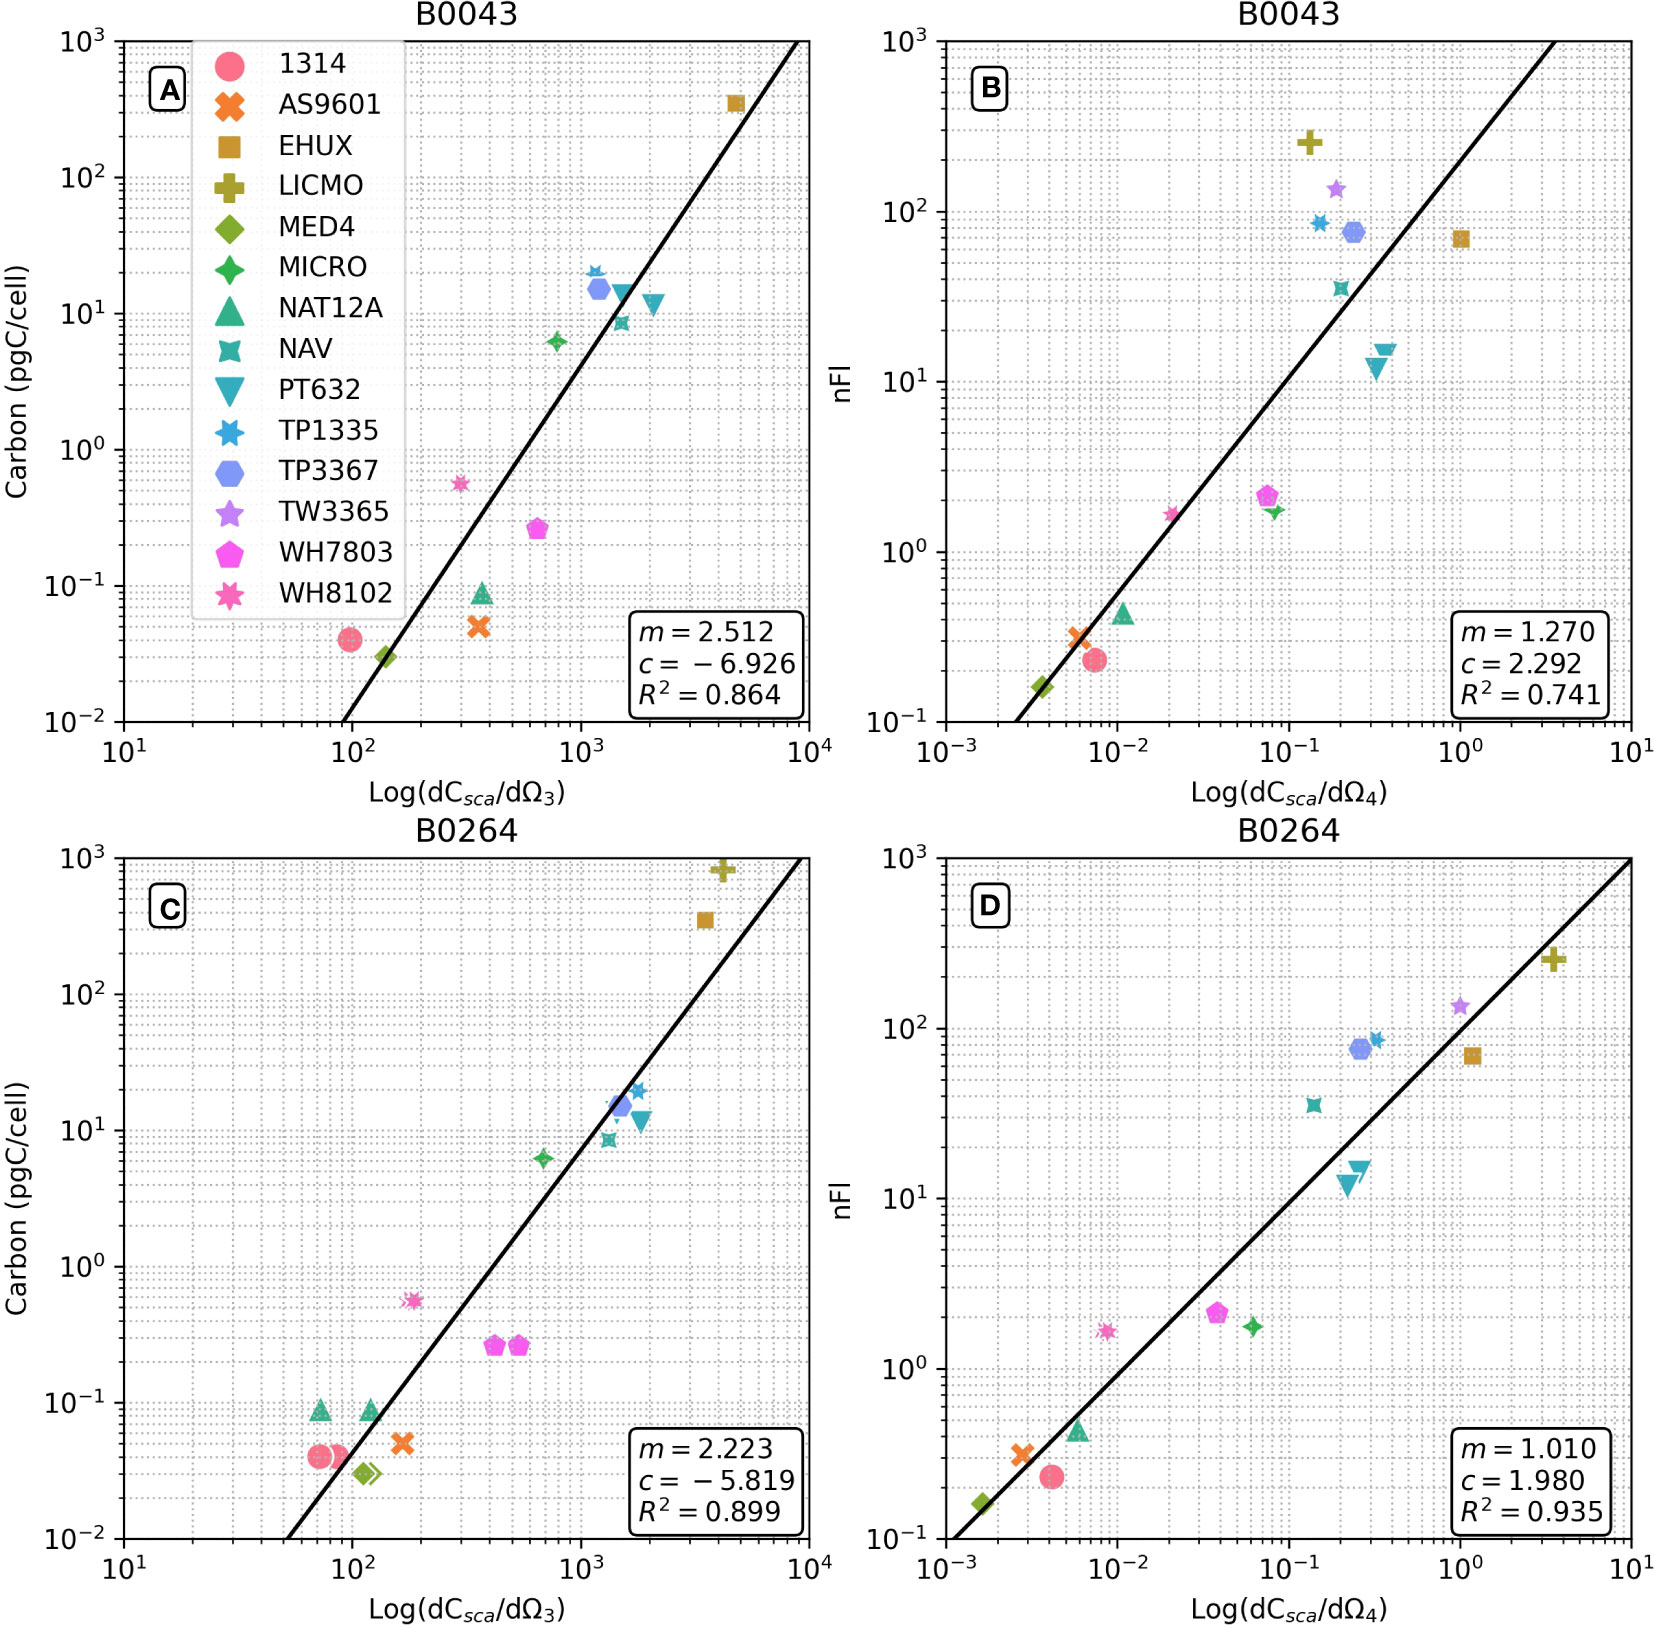
Figure 1 Flow cytometrically derived relationships between differential forward scatter and cellular carbon weight (A, C) and differential side scatter and normalized fluorescence (B, D) for a range of phytoplankton cells (see Table 1). Results for two Becton Dickinson FACSort™ flow cytometers shown: (A, B) serial #B0043; (C, D) serial #B0264. Regression statistics shown are in log10 space to use with equation of form 10c(dCsca/dΩn)m.
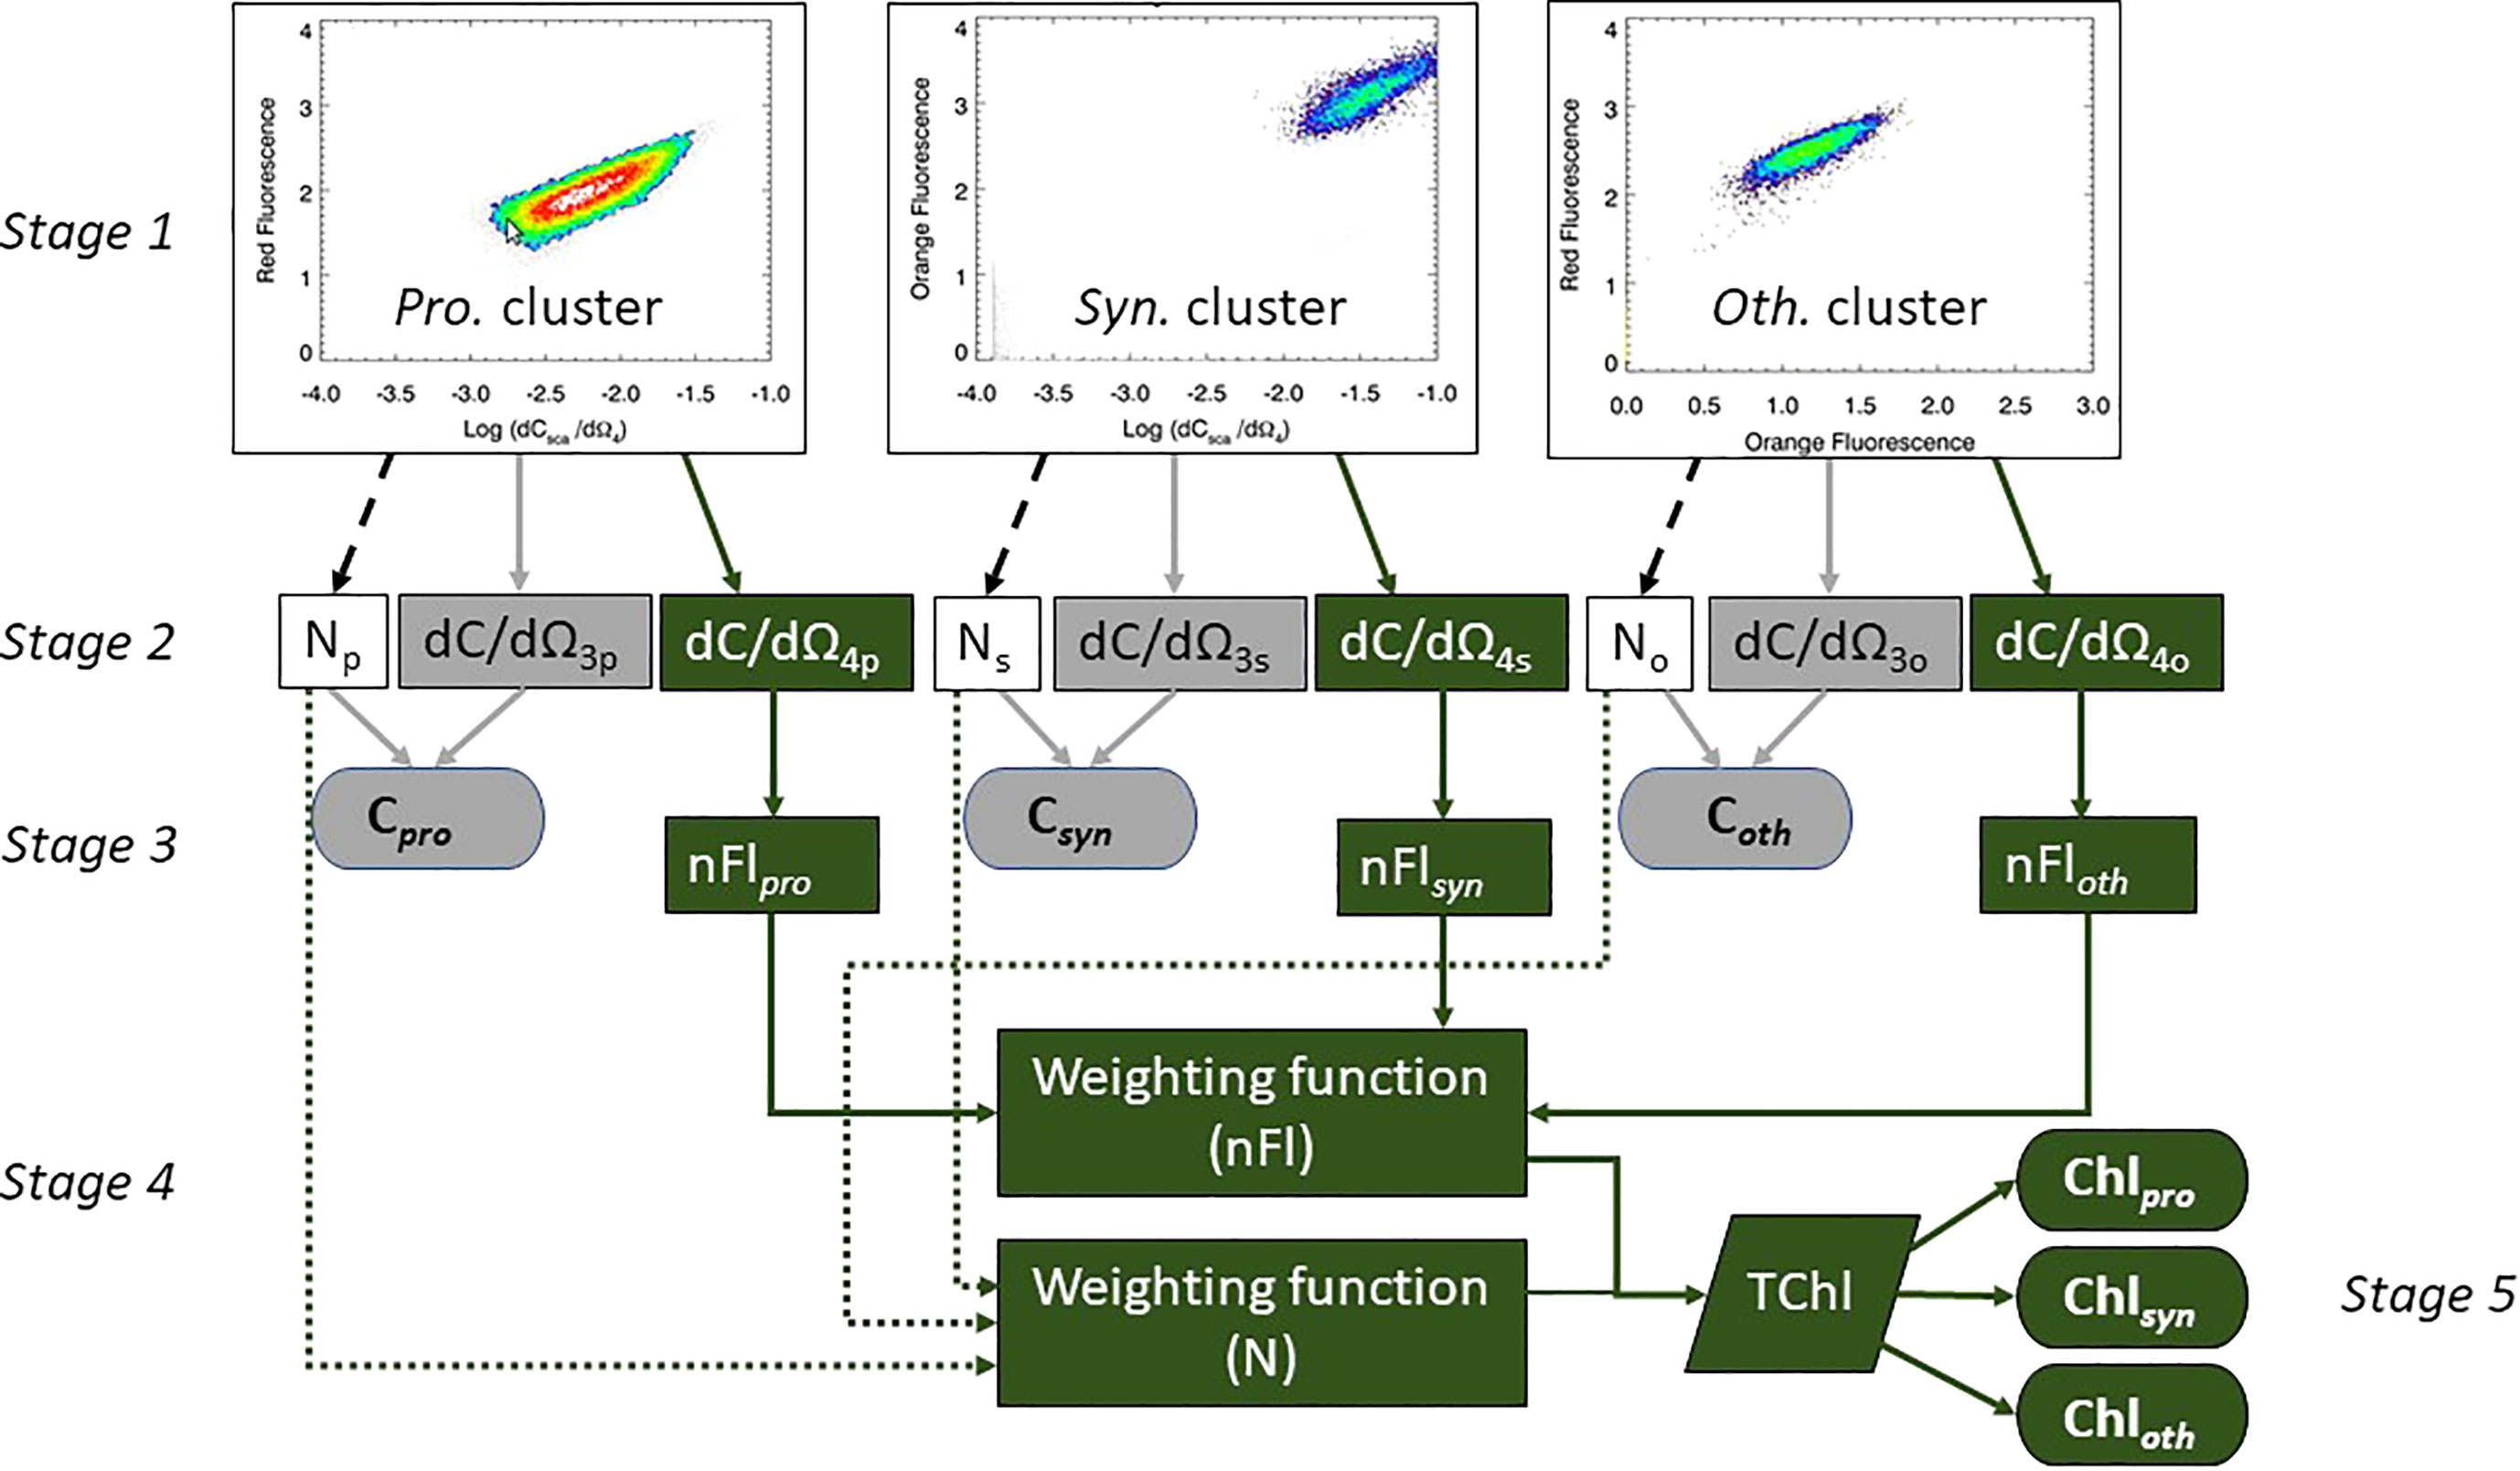
Figure 2 Stage 1 – cluster analyses with warmer colors showing higher density of points. Stages 2 – 4: Determination of Carbon (elements in grey) and Chlorophyll (elements in green) concentrations attributable to the different phytoplankton types, using a three and five stage process respectively.
Strict data filtering criteria were then applied to the resultant dataset for use within the Machine Learning (ML) analysis. This included: removing data points where agreement between the automatically clustered and manually gated abundances for individual species were not within 30% of each other; any instances of NaN in the FACS or ancillary datasets (e.g., nutrients); where the species-specific chlorophyll was ≤ 0.05 mg m-3 or ≤ 25% of the total chlorophyll concentration and minimization of the variability of the dCsca/dΩ3 in the sample. The latter was set to ±400 m2 sr-1 for Prochlorococcus; ± 800 m2 sr-1 for Synechococcus and ±1000 m2 sr-1 for the Nano setting species. This resulted in 1066 Prochlorococcus, 198 Synechococcus and 73 Nano (Other) samples. Table 3 shows a basic C:Chl statistical analysis of the filtered dataset based on the above criteria.
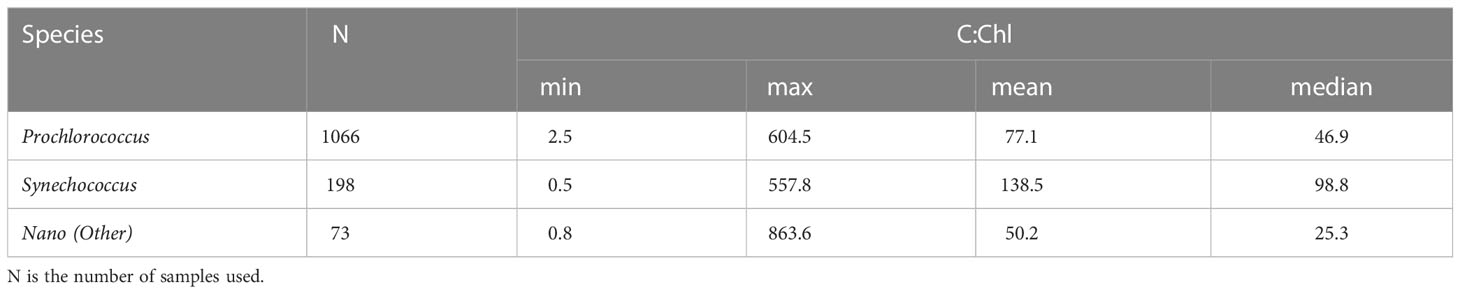
Table 3 Statistical analysis for the filtered C:Chl dataset.
Machine learning analyses
A Random Forest (RF) machine learning approach (Breiman, 2001) was used in order to gain an understanding of the environmental factors which influence phytoplankton carbon and chlorophyll. RF is an ensemble learning method for growing decision trees using subsets of the training data, known as bootstrap aggregation. The data were collected, and several predictor variables identified. The possible predictors identified from across the nine different AMT cruises were: Latitude, Depth, Temperature, Salinity, Oxygen, Nitrite, Nitrate, Phosphate, Silicate, and Species (Prochlorococcus, Synechococcus etc.). (Although Irradiance would be an obvious choice as a predictor variable, the dataset is dominated by pre-dawn samples, which subsequently precluded its use). The input variables were then standardized to scale each variable to a zero mean and unit variance, except the species information, as this is a categorical variable, encoded as a number. The data were then randomly separated into a training (70%) and a test (30%) data subset stratified across the nine AMT expeditions. This resulted in the training set being 1079 data samples, and test set as 463 data samples.
The RF model was then trained to predict phytoplankton C:Chl. A model was first trained to make the prediction based on all combined data, where phytoplankton species was included as a predictor variable. Then, further models were trained to make predictions on the individual northern and southern Atlantic gyres (see e.g., Smyth et al. (2017)) defined by their Longhurst province (Longhurst et al., 1995). The northern gyre is defined as the regions North Atlantic Subtropical - West (NASW), North Atlantic Subtropical - East (NASE) and North Atlantic Trades (NATR). The southern gyre is defined as region South Atlantic Trades gyraL (SATL). Test and training data set separation was performed using the exact same process for the separate northern gyre (training: 255; test: 110) and southern gyre (training: 394; test: 170) regions. This left 613 samples not included within either gyral region.
A SHAP (Shapley Additive exPlanations) analysis (Lundberg and Lee, 2017) was performed on the RF predictors. SHAP analysis compensates for any collinearity of multiple variables by using a game theory approach to variable analysis (Lundberg and Lee, 2017). SHAP analysis manages the interdependence and correlations of variables, thereby producing an insightful variable importance metric. SHAP analysis enables a value to be assigned to each variable (i.e. Latitude, Depth, Temperature, Salinity, Oxygen, Nitrite, Nitrate, Phosphate, Silicate, and Species) which indicates how much that variable will change the output predicted (i.e., C:Chl) value. Positive SHAP values indicate an increase in the C:Chl ratio, and vice versa; a SHAP value of zero means no impact on the predicted C:Chl ratio. A ranking by SHAP value allows a better insight into which environmental variables are the drivers for the C:Chl ratio.
Results
Laboratory culture determined C and nFl
Figure 1 shows that there are strong relationships (R2 = 0.864 and 0.899 for B0043 and B0264 respectively) between cellular carbon content and dCsca/dΩ3 for different cultures over five and two orders of magnitude respectively for two different flow cytometers (Figures 1A, C). Similarly, robust relationships (R2 = 0.741 and 0.935 for B0043 and B0264 respectively) were found between cellular nFl and dCsca/dΩ4 for different cultures over four orders of magnitude in both axes (Figures 1B, D). Table 2 shows that for three other flow cytometers, similar robust (R2 > 0.8) relationships hold between the FACS measured forward scatter and cellular carbon content.
AMT field determined C:Chl
Figure 3 shows the physical (Figures 3A, B) and biogeochemical (Figures 3C–F) conditions throughout all the AMT (18 – 29) transects (50°N – 50°S) over the depths 0 – 200 m. The major features of the AMT transect are the northern and southern gyre regions, characterized by warm (> 25°C), high salinity (>37 PSU) deep surface mixed layer (>100 m) cores, separated by the warm (>27°C) but fresher (<36 PSU) equatorial upwelling zone (~10°N). The gyres are biogeochemically characterized by lower surface mixed layer oxygen (Figure 3C: 180 – 220 µM), nitrate (Figure 3D) approaching or below the limit of detection (<0.01 µM) and a deep (Figure 3F: up to 150 – 200 m) chlorophyll maximum (0.1 – 0.3 mg m-3). Other features of note are the higher phosphate concentrations (Figure 3E: 0.3 µM) in the southern compared with the northern gyre (<0.2 µM) with implications for nutrient stoichiometry, and the lower oxygen zone (<120 µM) in the equatorial upwelling region (Figure 3C). For a further analysis of the biogeochemical traits of the AMT transect see Smyth et al. (2017).
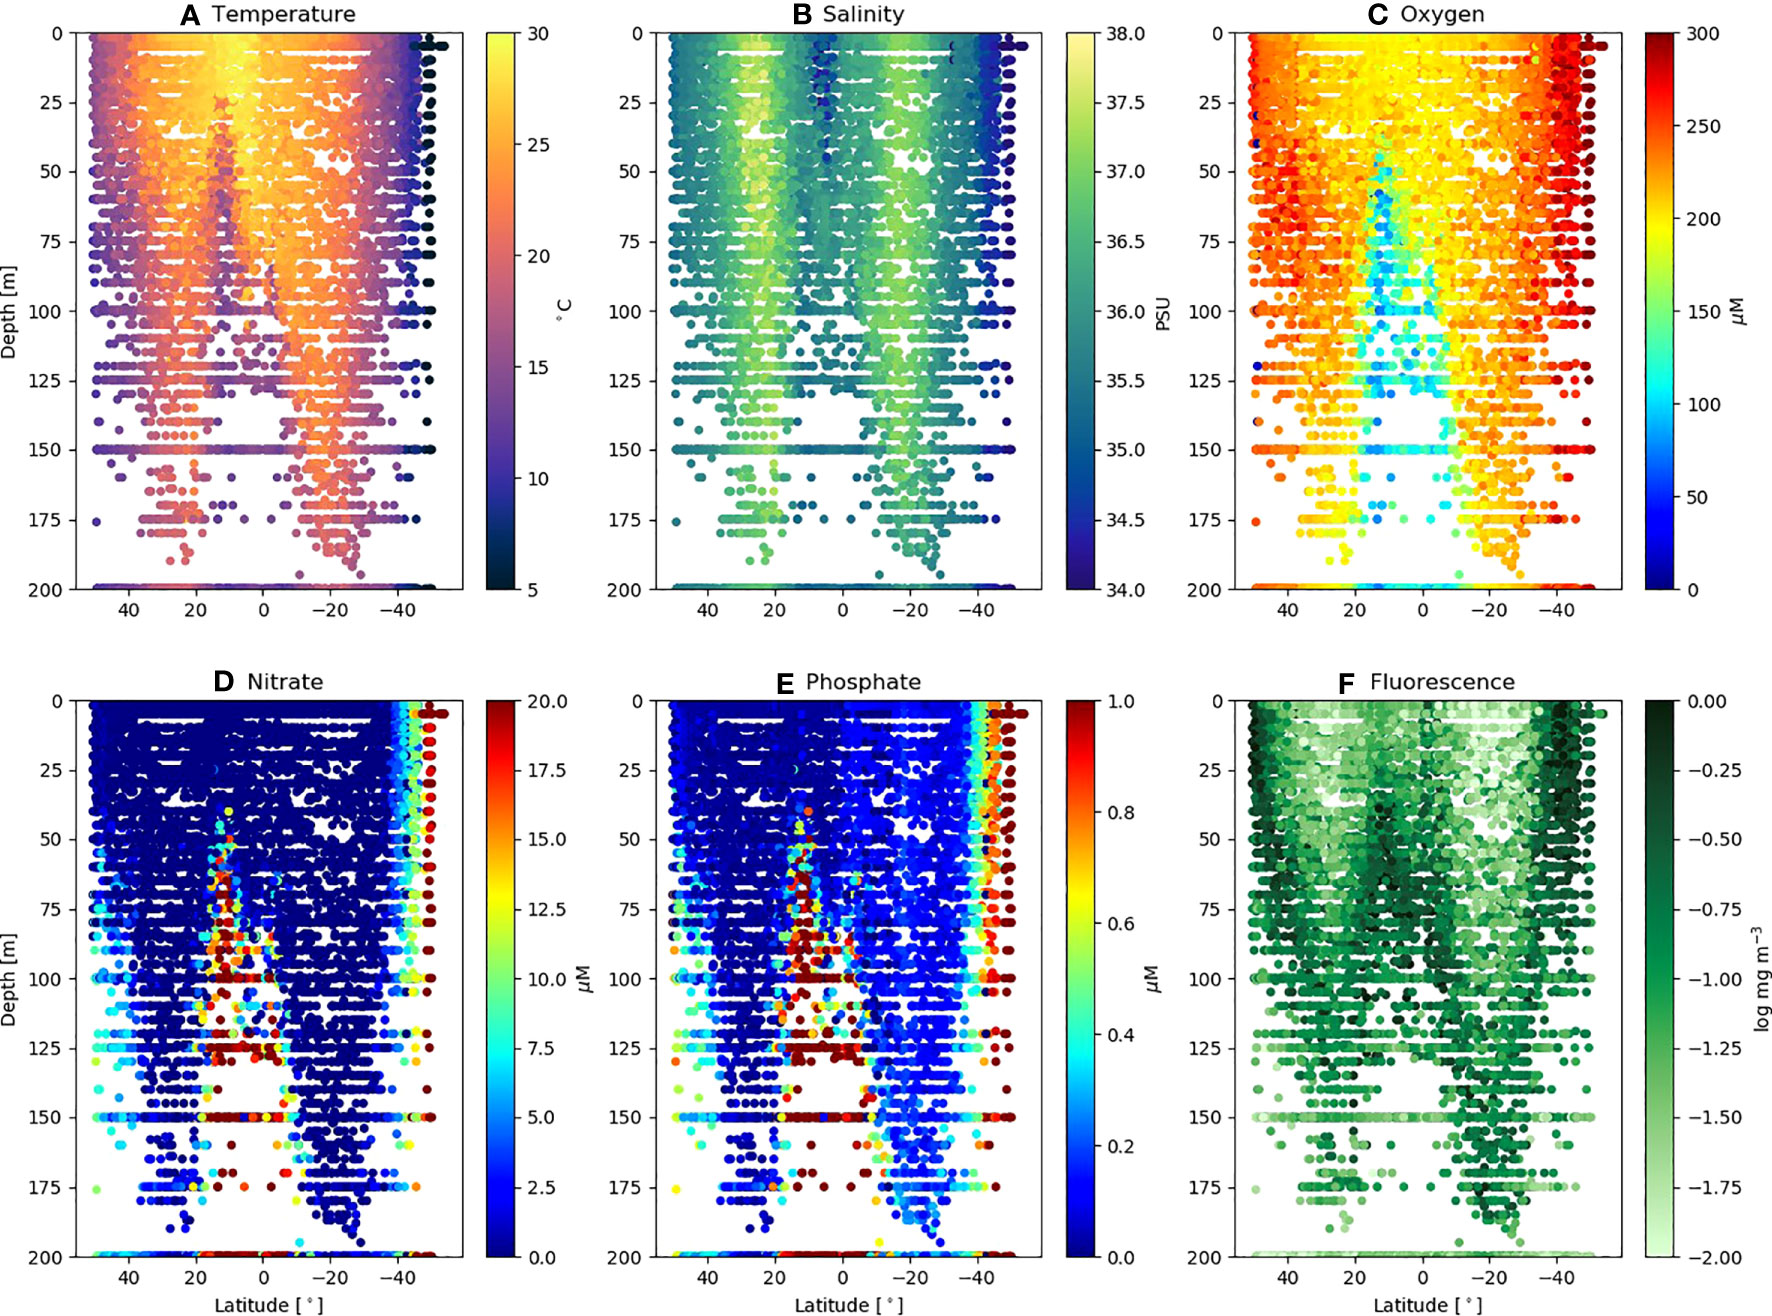
Figure 3 Environmental variables for AMT18 – 29 plotted as a function of latitude and depth. Individual values of (A) Temperature (°C); (B) Salinity (PSU); (C) Oxygen (µM); (D) Nitrate (µM); (E) Phosphate (µM) and (F) Fluorescence (log mg m-3), extracted as points where discrete FACS samples obtained.
The FACS measured Prochlorococcus differential forward and side scatter (Figures 4A, B) shows regions of enhanced scattering which clearly follow the depth of the thermocline (base of the surface mixed layer), with clear differences between the northern and southern gyres. The range of maximum dCsca/dΩ3 and dCsca/dΩ4 of 300 – 450 m2 sr-1 and 0.01 – 0.03 m2 sr-1 respectively is at a depth of >75 m in the northern gyre, but >125 m in the southern. When converted to total carbon (Figure 4C) using the regression statistics (Figure 1A or C) and multiplied by the abundance (Stage 2 of Figure 2) the patterns show a tendency for Prochlorococcus carbon (Cpro) to increase with depth towards the thermocline (typical values<5 mg m-3 in the surface; 20 – 50 mg m-3 close to the base of the mixed layer). The species-specific Chl (Chlpro) also show an increase with depth towards the thermocline (Figure 4E), in some cases exceeding 0.1 mg m-3. Taking the ratio of Cpro : Chlpro results in a range of values between 1 – 600 (Figures 4F, 5A; Table 3). For a similar visualization of Synechococcus and the generic Other class, see Figures S1, S2.
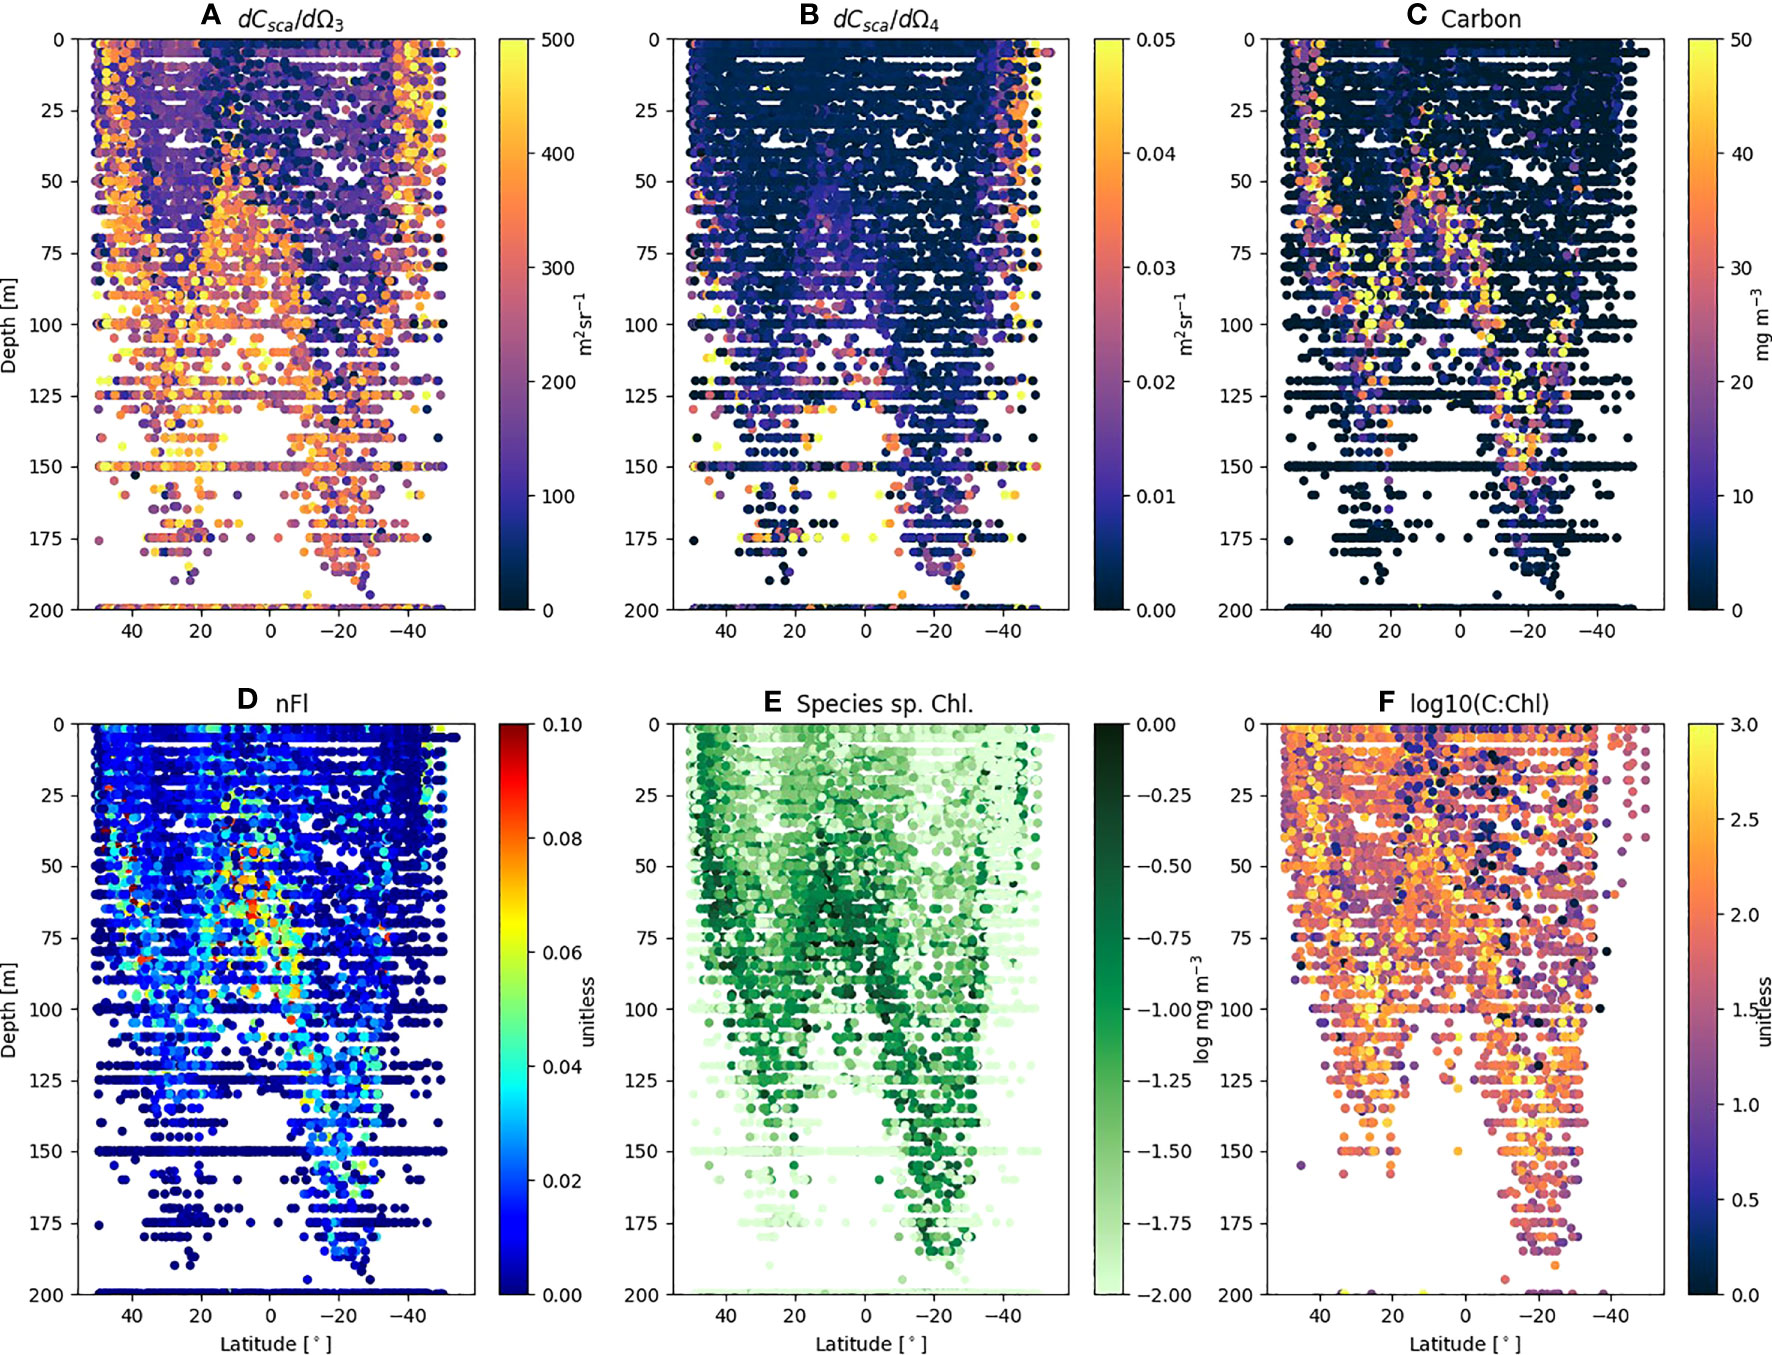
Figure 4 FACS scattering and derived variables for Prochlorococcus from AMT18 – 29 plotted as a function of latitude and depth. Individual sample values of (A) mean differential forward scatter (dCsca/dΩ3); (B) mean differential side scatter (dCsca/dΩ4); (C) Total Carbon (mg m-3); (D) normalized Fluorescence (nFl); (E) Species specific Chl (log mg m-3); (F) log carbon to chlorophyll ratio (C:Chl).
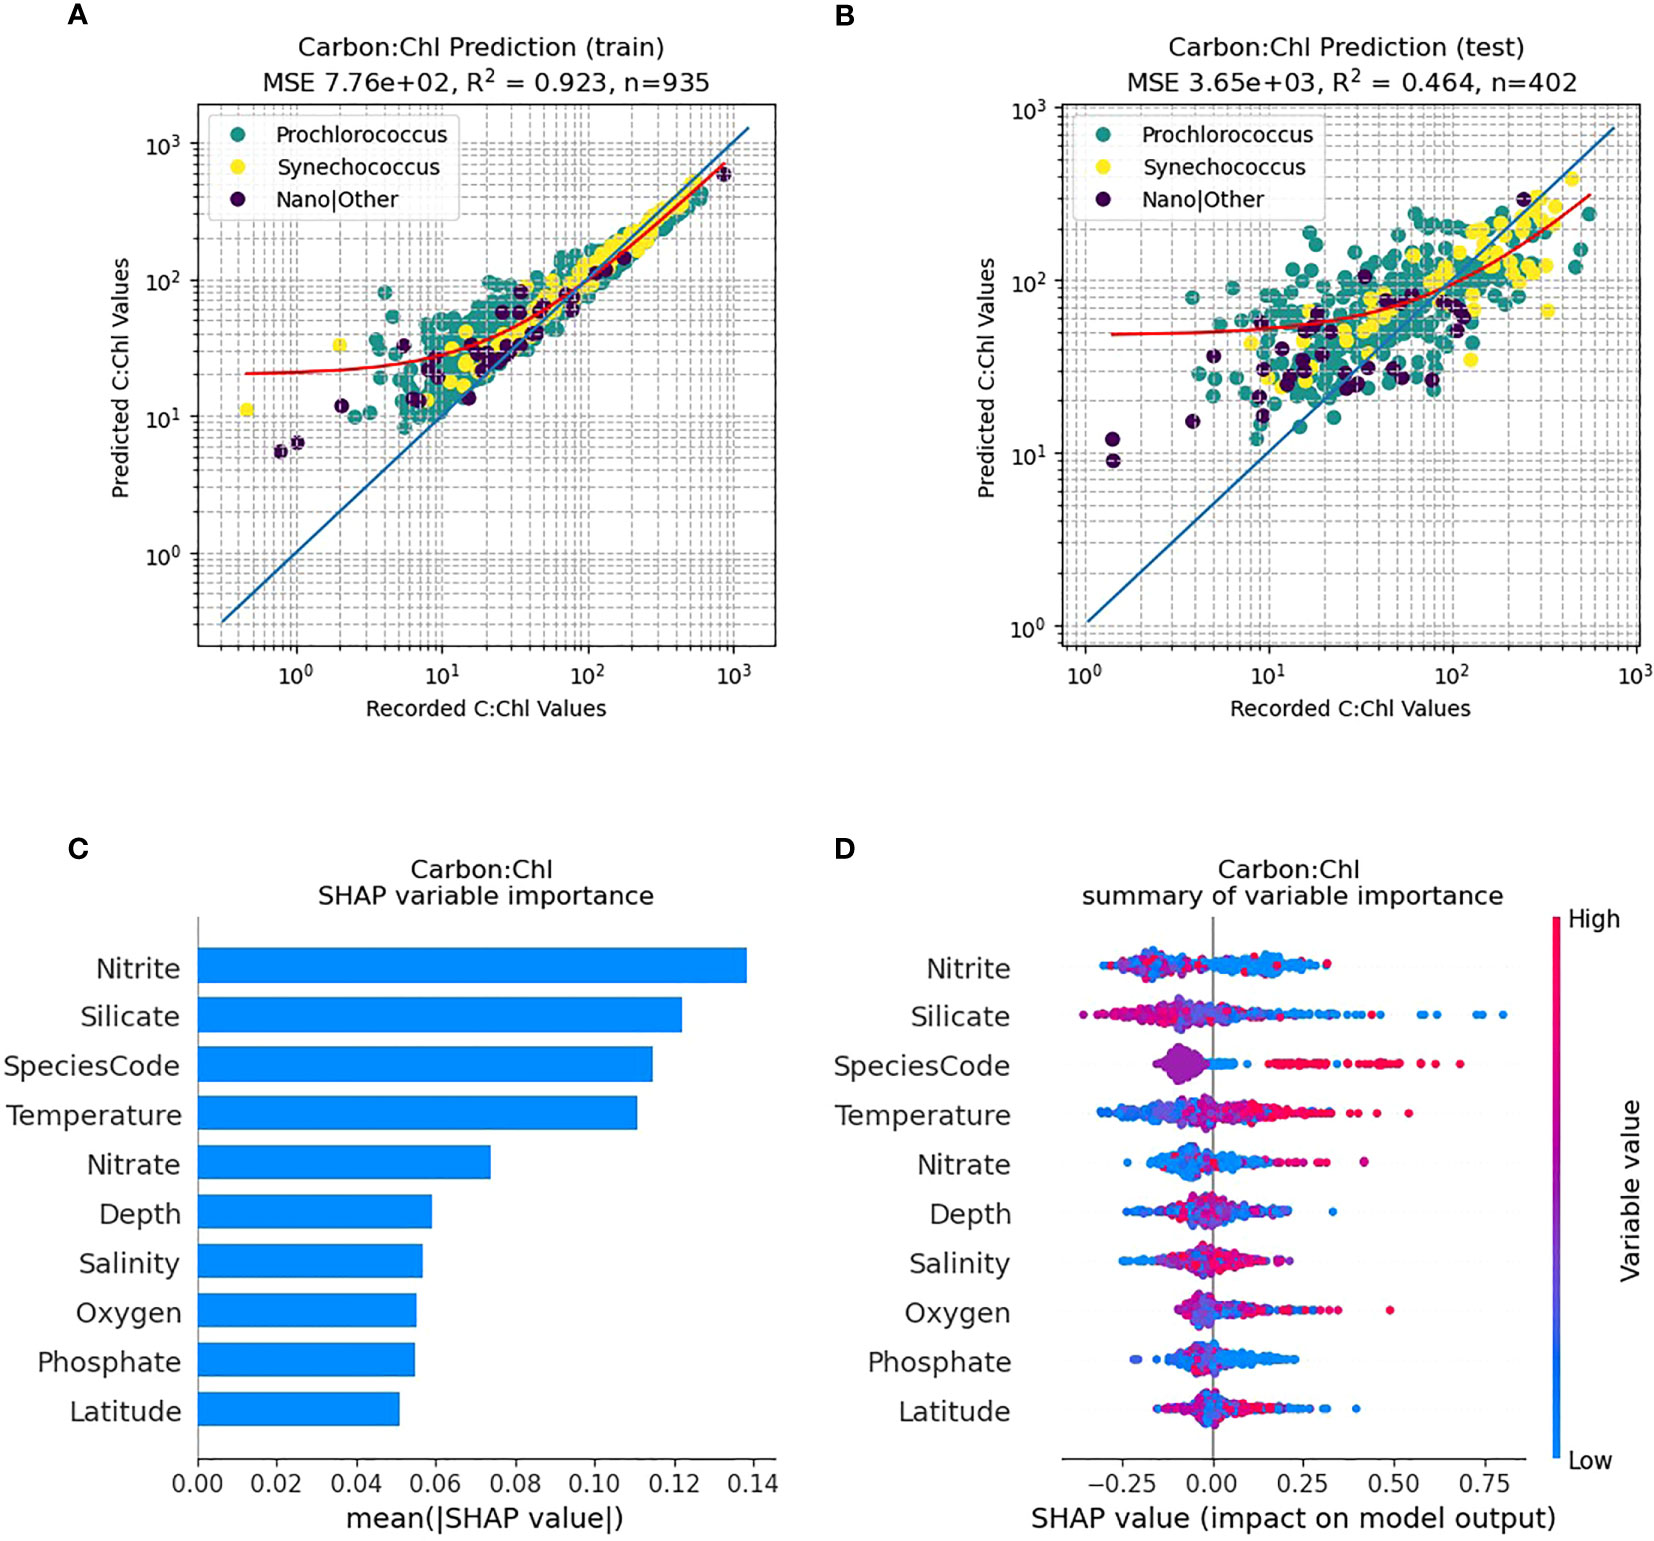
Figure 5 RF model prediction and analysis of C:Chl for all AMT provinces. (A) The RF prediction results for the training dataset, identified per species, with the red line representing the best fit and the blue line the 1:1 (perfect prediction). (B) The RF prediction results for the test dataset. (C) The SHAP variable importance of each predictor variable. (D) Impact of the variable on the predicted output, based on the value of the variable. The colours represent whether the variable is high or low, and the horizontal axis represents a positive or negative change on the predicted output C:Chl.
Environmental drivers of C:Chl
Using all the species data combined over all provinces the trained RF model (Figure 5A) can predict C:Chl with a high percentage of variance explained (R2 = 0.931). For the independent test dataset (N=463) (Figure 5B) the predictions of C:Chl are markedly poorer (R2 = 0.359). The ML model tends to predict C:Chl most accurately over a range between 20 – 200 for both the training and test datasets (Figures 5A, B); the prediction is less reliable for C:Chl< 15. This is partly caused by an imbalance within the sampling, as lower carbon and chlorophyll values are less common and hence more challenging to represent. The corresponding SHAP analysis (Figure 5C) identifies that phytoplankton species (Prochlorococcus, Synechococcus etc.) are the most important predictor of C:Chl, followed by nitrite, silicate and temperature. Figure 5D shows the impact that high and low variable values will have on the model output. Silicate tends to have a negative correlation with the prediction of C:Chl, and low values of nitrite will have either a strong positive or negative impact on the results, whereas high nitrate levels have minimal impact on the C:Chl values over the AMT transect.
The northern gyral provinces (Figure 6), are dominated by Prochlorococcus. The RF predictive capability of C:Chl using the training dataset (N=255) renders a good fit to the data (Figure 6A; R2 = 0.89), however the independent test data set has a poorer fit (Figure 6B; N=110, R2 = 0.27). The SHAP analysis shows that silicate is one of the dominant drivers of C:Chl in the northern gyre, followed by oxygen and nitrite (Figure 6C). As in Figure 5D for all ocean provinces, silicate tends to have a negative correlation with the prediction of C:Chl in the northern gyre (Figure 6D), and low values of nitrite have a slightly positive impact. In contrast, the RF predictivity of C:Chl in the southern gyre is markedly improved (Figure 7). The training data (Figure 7A, N=394) has a good fit (R2 = 0.94) and the independent test data (Figure 7B, N=170) has a moderate fit (R2 = 0.68). The SHAP analysis shows that C:Chl predictability in the southern gyre is driven by silicate and species type (Figure 7C). For further analyses of other species see Figures S3–S7.
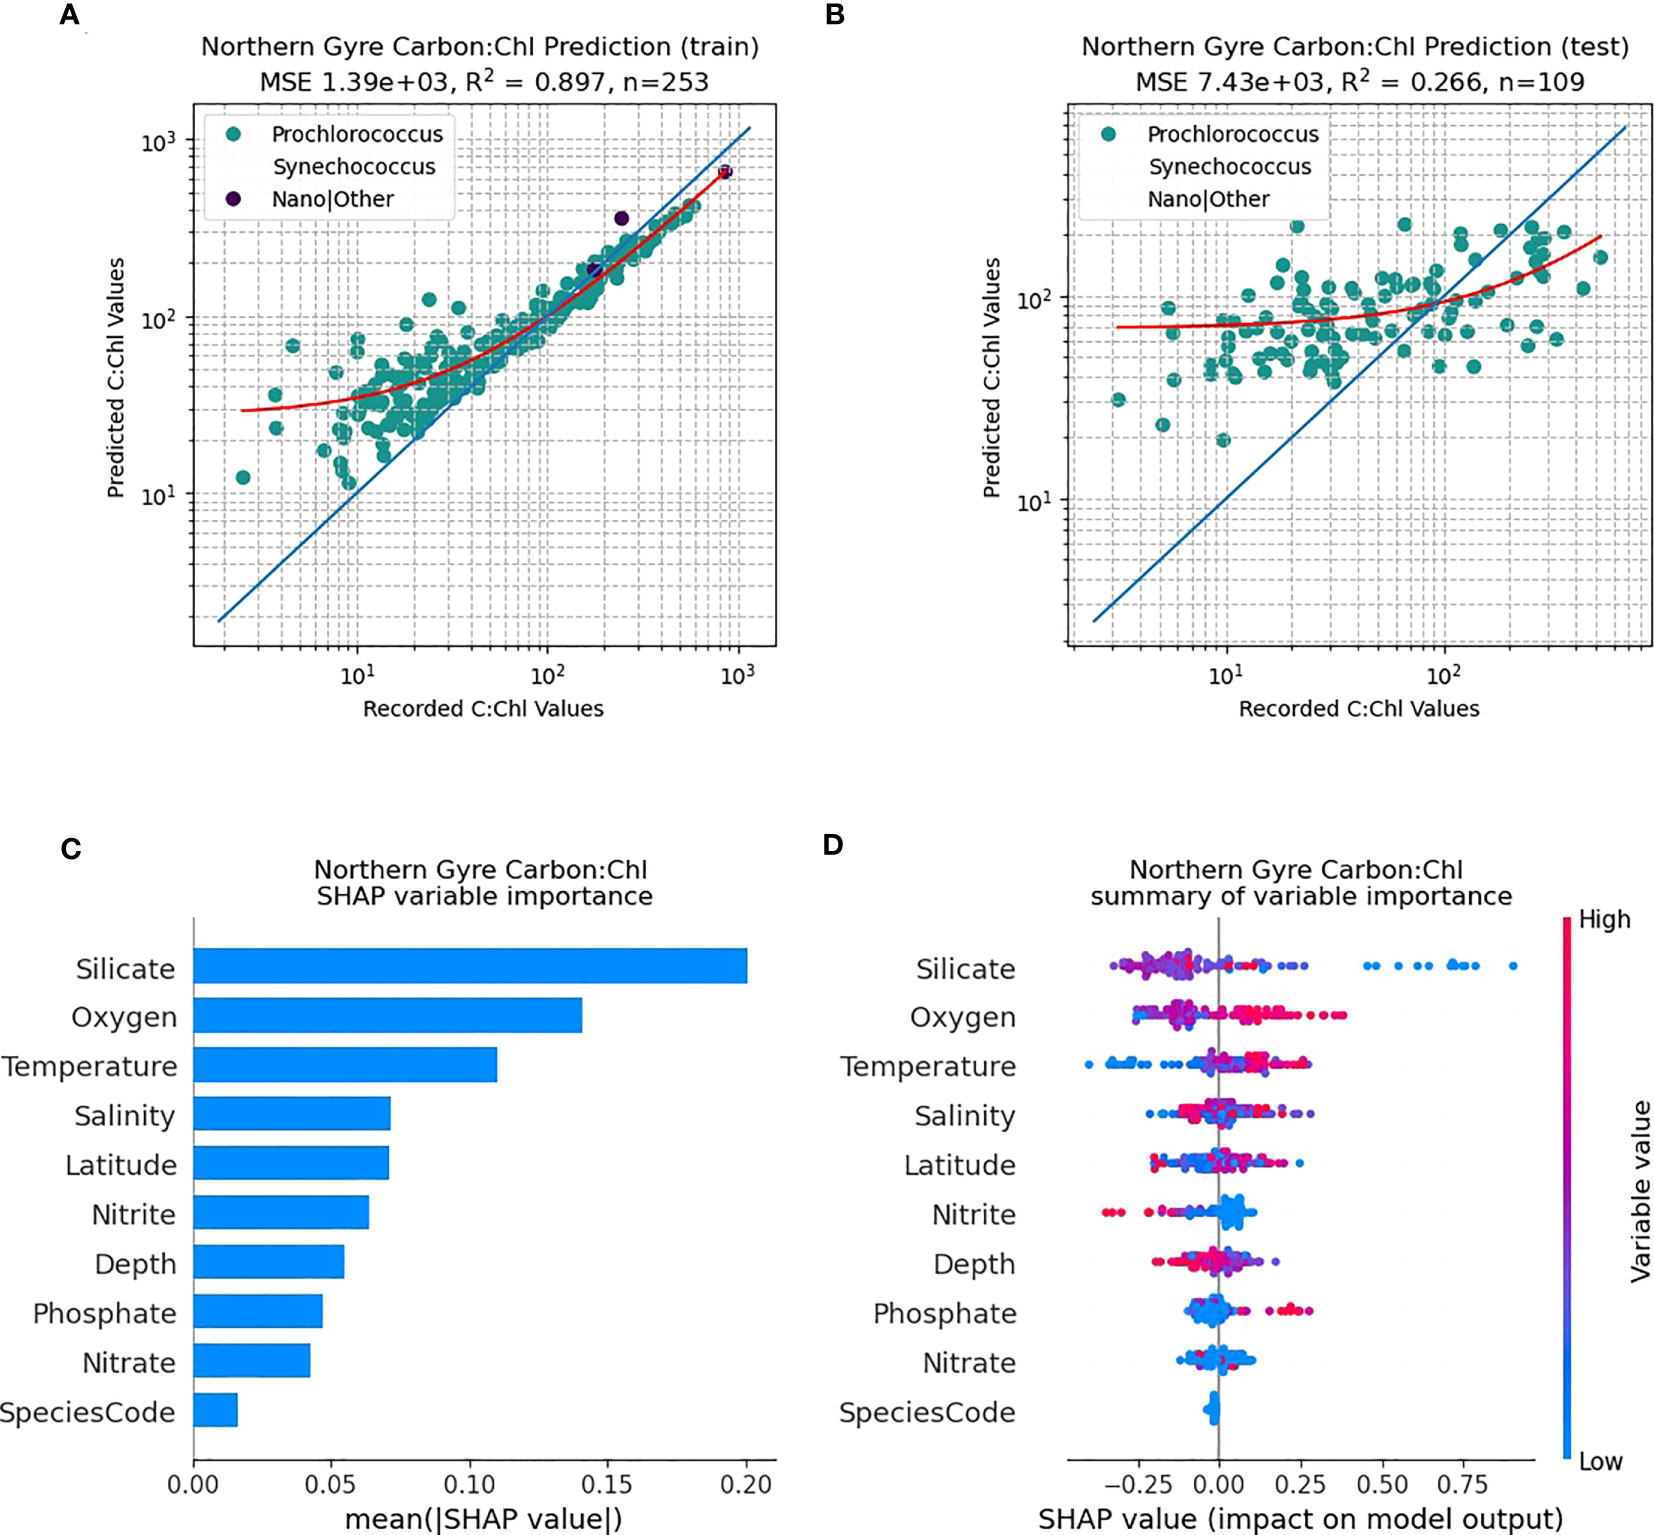
Figure 6 RF model prediction and analysis of C:Chl for the Northern Gyre provinces. (A) The RF prediction results for the training dataset, identified per species, with the red line representing the best fit and the blue line the 1:1 (perfect prediction). (B) The RF prediction results for the test dataset. (C) The SHAP variable importance of each predictor variable. (D) Impact of the variable on the predicted output, based on the value of the variable. The colours represent whether the variable is high or low, and the horizontal axis represents a positive or negative change on the predicted output C:Chl.
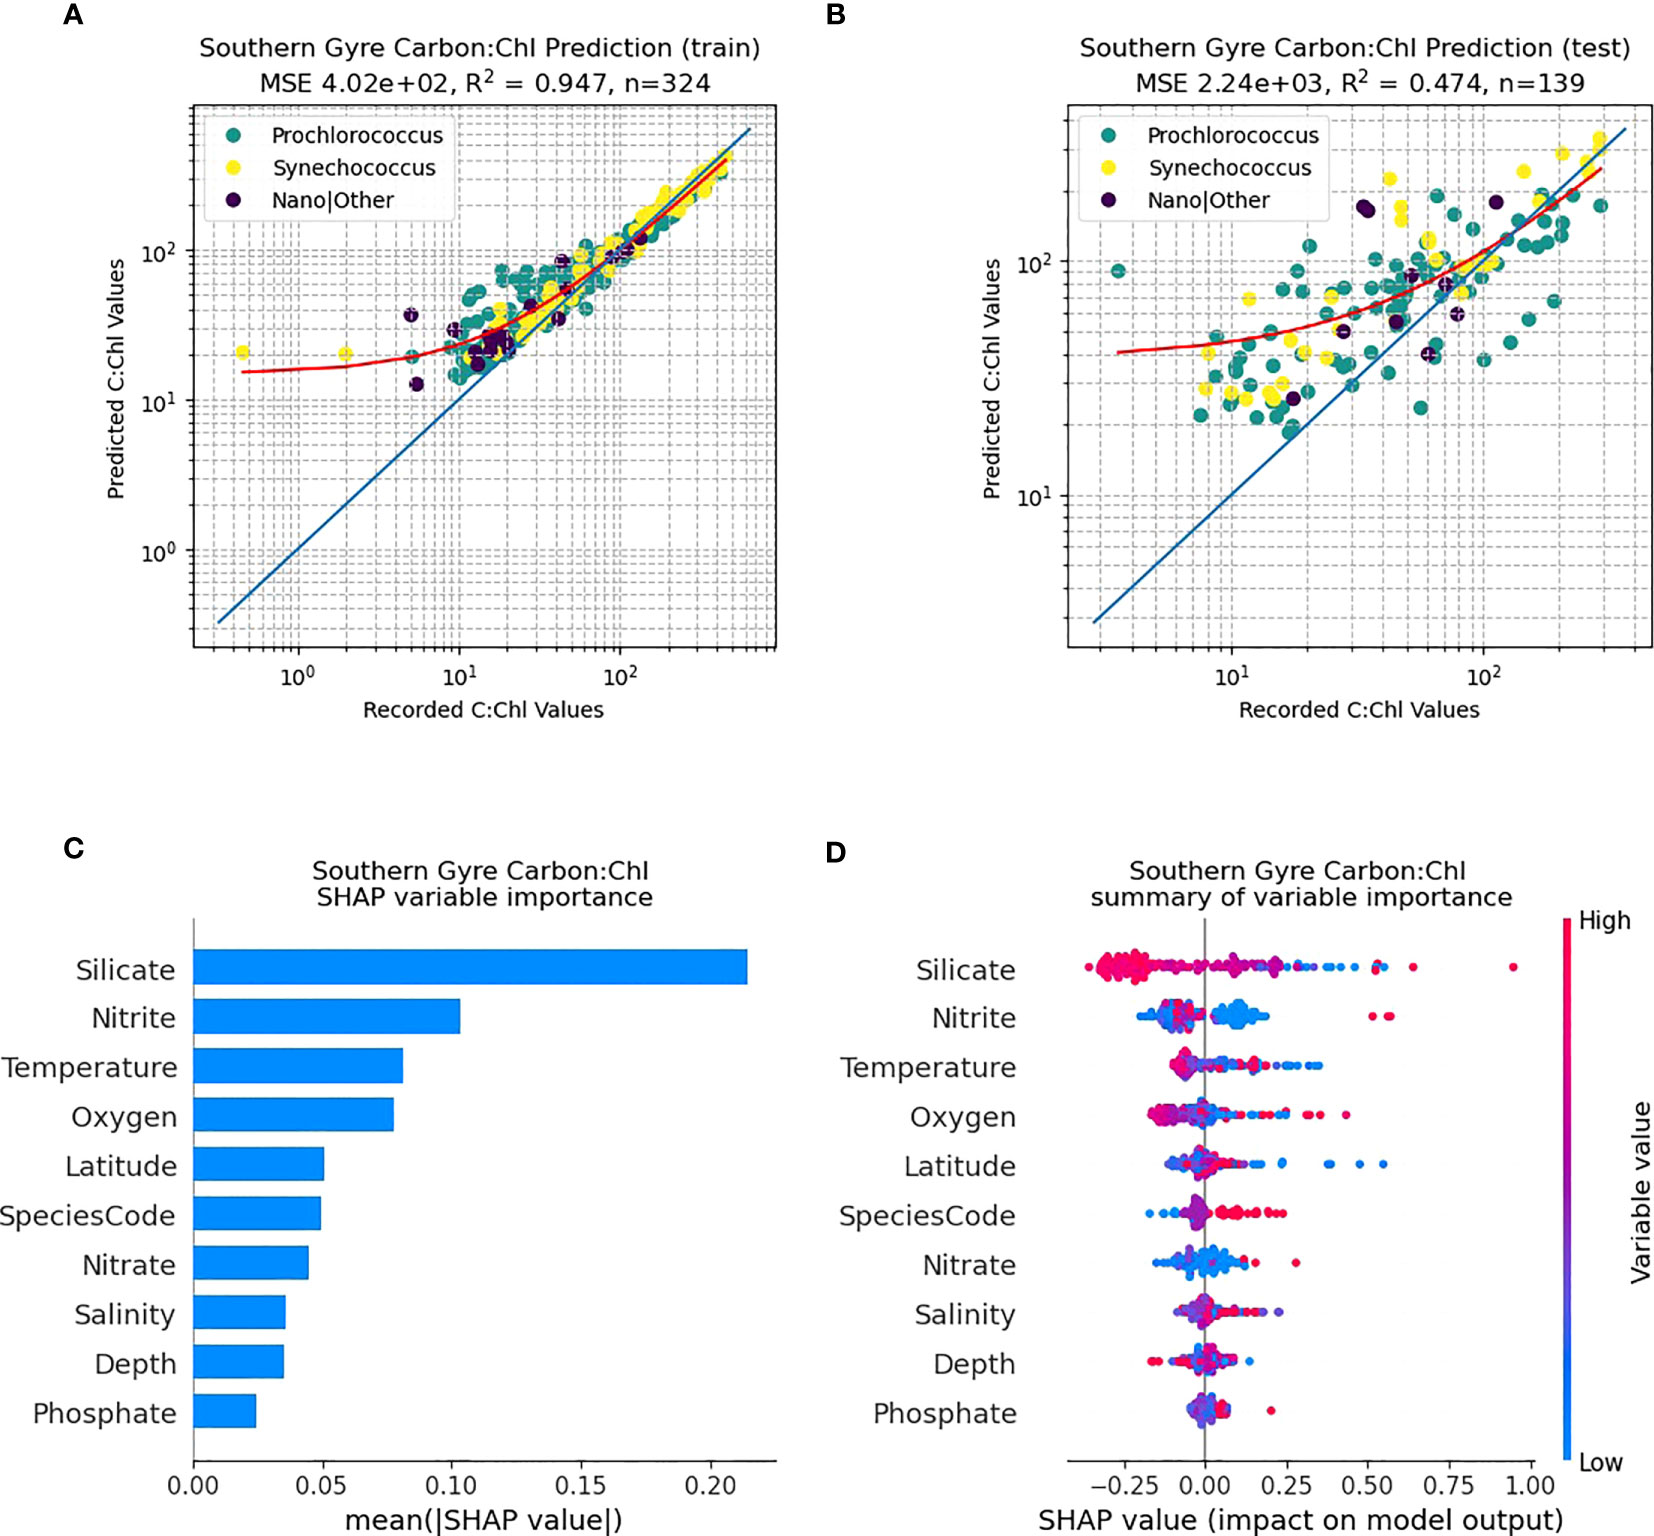
Figure 7 RF model prediction and analysis of C:Chl for the Southern Gyre provinces. (A) The RF prediction results for the training dataset, identified per species, with the red line representing the best fit and the blue line the 1:1 (perfect prediction). (B) The RF prediction results for the test dataset. (C) The SHAP variable importance of each predictor variable. (D) Impact of the variable on the predicted output, based on the value of the variable. The colours represent whether the variable is high or low, and the horizontal axis represents a positive or negative change on the predicted output C:Chl.
Discussion
This paper effectively highlights the use of FACS for in vivo determination of cellular carbon content across a variety of phytoplankton species with sizes ranging from 0.5 to 10 µm. This is particularly powerful as FACS can distinguish different phytoplankton species using automated (Smyth et al., 2019) or manual (Tarran et al., 2006) clustering techniques. This removes the need for size fractionated filtering and subsequent elemental analysis e.g., using a CHNS analyser, and can distinguish the contribution from individual cells (Pallon et al., 1999). FACS has the additional benefit of being high throughput in comparison to other techniques such as light microscopy and is readily applicable to machine learning tools and methodologies (Thomas et al., 2018). Advances in miniaturization, and electro-optical techniques may soon make in situ measurements of cellular carbon using platforms such as moorings (Olson et al., 2017) and gliders a reality. Further work is needed in addressing issues concerning cellular shape and heterogeneous internal structure (Smyth et al., 2021), particularly for the smaller size classes of phytoplankton such as Prochlorococcus. We have attempted to overcome these typical limitations imposed by light scattering approaches by taking the geometric mean values of dCsca/dΩ3 and dCsca/dΩ4 and removing data from the RF analysis where there is an associated large standard deviation. Figures 1, 4; Table 2.
The high values of Cproc (Figure 4C) at the deep chlorophyll maximum (DCM) seem counterintuitive given the well-documented high abundances of Prochlorococcus in the surface layers of the tropical Atlantic (Johnson et al., 2006; Tarran et al., 2006; Smyth et al., 2019). Cultured Prochlorococcus strains (MIT9312, MED4, AS9601, NAT12A) typically display dCsca/dΩ3 values in the range of 100 – 400 m2 sr-1 (Figure 1); consistent with field observations of 50 – 500 m2 sr-1 (Figure 4A). However, when these data are translated into cellular carbon content (Table 2), we observe a range from 0.002 – 0.72 pgC cell-1, spanning 2.5 orders of magnitude. This contrasts significantly with the more modest variations in Prochlorococcus cellular carbon content observed from the surface to the deep chlorophyll maximum (DCM) at BATS (0.05 pgC surface; 0.15 pgC DCM - Casey et al. (2013)) and HOT (0.02 pgC surface; 0.114 pgC DCM - Casey et al. (2019)) time-series stations. This discrepancy may underline a potential limitation in our methodology, as the log-log transformation from differential forward scattering to carbon might exacerbate any uncertainties in differential forward scatter and those linked to a log-log regression, especially for smaller cells. Our regression between differential forward scatter and cellular carbon resulted in slopes of 2.51 and 2.22, depending on the instrument used (Figure 1). These values are noticeably higher than the 1.74 value derived from a similar instrument (Burbage and Binder, 2007). The higher coefficients in our regression model may be responsible for the greater cellular content of the large-sized Prochlorococcus strain (Figure 1 - NAT12A) estimated by scattering (0.3 pgC) compared to that measured by elemental analysis (0.08 pgC). These findings suggest that our methodology may require further refinement to accurately assess the cellular carbon content in different phytoplankton species. As a next step, we propose to test and validate our approach not merely on cultured specimens, but also on natural phytoplankton populations using a fine-resolution size fractionation approach (Casey et al., 2019). This will provide a more comprehensive evaluation of our technique, thereby enhancing its precision and applicability.
An empirical relationship between side scatter and chlorophyll might not be expected and deserves some scrutiny as there are several confounding factors one might consider. Firstly, the chlorophyll-a molecule absorbs quite strongly (0.03 m2 [mg chlorophyll-a]-1) at the wavelength of the blue (488 nm) laser used for dCsca/dΩ4 determinations, stronger still for the divinyl chlorophyll-a molecule synthesized by Prochlorococcus (0.05 m2 [mg chlorophyll-a]-1; Bricaud et al. (2004)). The expectation would be that, for otherwise physiologically similar cells, the scattering amplitude would decrease, rather than increase with increasing cellular chlorophyll-a concentrations. Secondly, there are potentially many overlapping absorption spectra at 488 nm due to the presence of multiple pigments, a problem compounded further by changing pigment stoichiometries associated with photoacclimation and diel cycles (Moore et al., 1995). However, we expect the magnitude of the contribution of pigment absorption to dCsca/dΩ4 to be relatively small compared with the scattering amplitude, with a scattering-to-attenuation ratio of approximately 0.8 at 488 nm (Claustre et al., 2002). One rationale for the observed positive relationship between chlorophyll-a and dCsca/dΩ4 is that it reflects changes in internal structure associated with both photoacclimation and photoadaptation (Ting et al., 2007). These are the thylakoid folds, the carboxysomes, and the large photosystem complexes, antennae proteins and associated membrane proteins that change within some stoichiometric bounds with light harvesting pigments. We speculate that these structural differences contribute a positive scattering component that exceeds the negative absorption component to dCsca/dΩ4, resulting in the overall positive empirical relationship we observed in our cultures. Nevertheless, higher order processes and variability in photophysiology in a dynamic ocean may complicate our interpretation of dCsca/dΩ4 as a proxy for chlorophyll-a content.
A completely contained methodology to quantify cellular chlorophyll concentration still requires a multi-staged approach, which we describe in this paper, with the introduction of errors when assigning a given chlorophyll concentration to an individual species group. This may possibly be solvable by using calibrated fluorescence beads, with a rigorous calibration methodology against such standards on a daily basis (Smyth et al., 2019). Simultaneous measurements of the real and imaginary parts of the cellular refractive index - can be empirically related to the carbon and chlorophyll content respectively (Stramski, 1999; DuRand et al., 2002; Agagliate et al., 2018). As we have previously reported (Smyth et al., 2019) our calibrated technique only returns the real refractive index which stymies further determination of C:Chl. However, the strong empirical relationships, albeit individual detector specific (Figure 1), between FACS measured forward and side scatter and carbon and (normalized) fluorescence respectively would appear to offer more potential than a technique based on the determination of refractive index.
Our reported ranges of C:Chl (Table 3) are broadly consistent with other literature values: Graff et al. (2015) reported C:Chl, albeit for a limited portion and depth (20 m) of the Atlantic Ocean, between a range of 35 – 408 (median, 99) for all phytoplankton types. Veldhuis and Kraay (2004) give a range of 93 – 122 for Prochlorococcus, and 38 – 58 for Synechococcus which is within range of the values reported here. The range of 9 - 499 for Prochlorococcus reported by Phongphattarawat et al. (2023), based on a pigment-based analysis of a global dataset that included AMT data, is close to the range reported here. Figure 8 shows an intercomparison of Prochlorococcus C versus Chl between this work and previous literature values. When data points are selected based on the dominant type present in the sample [i.e., >50% of the chlorophyll concentration can be attributable to Prochlorococcus (Figure 2)] regression statistics of slope: 0.672 ± 0.039, intercept: 1.392 ± 0.045, R2: 0.219 are obtained. This compares with slope: 0.843, intercept: 1.711, R2: 0.41 for Phongphattarawat et al. (2023) using 49 fg C cell-1 (Cailliau et al., 1996) and slope: 0.788, intercept: 1.798, R2: 0.47 for Phongphattarawat et al. (2023) using 52 and 158 fg C cell-1 for euphotic and sub-euphotic populations, respectively (Casey et al., 2013). Our values tend towards C:Chl = 145 (Sathyendranath et al., 2009) at low values (~0.01 mg m-3) of Chl, and diverge away (below) this at higher (~1 mg m-3) Chl.
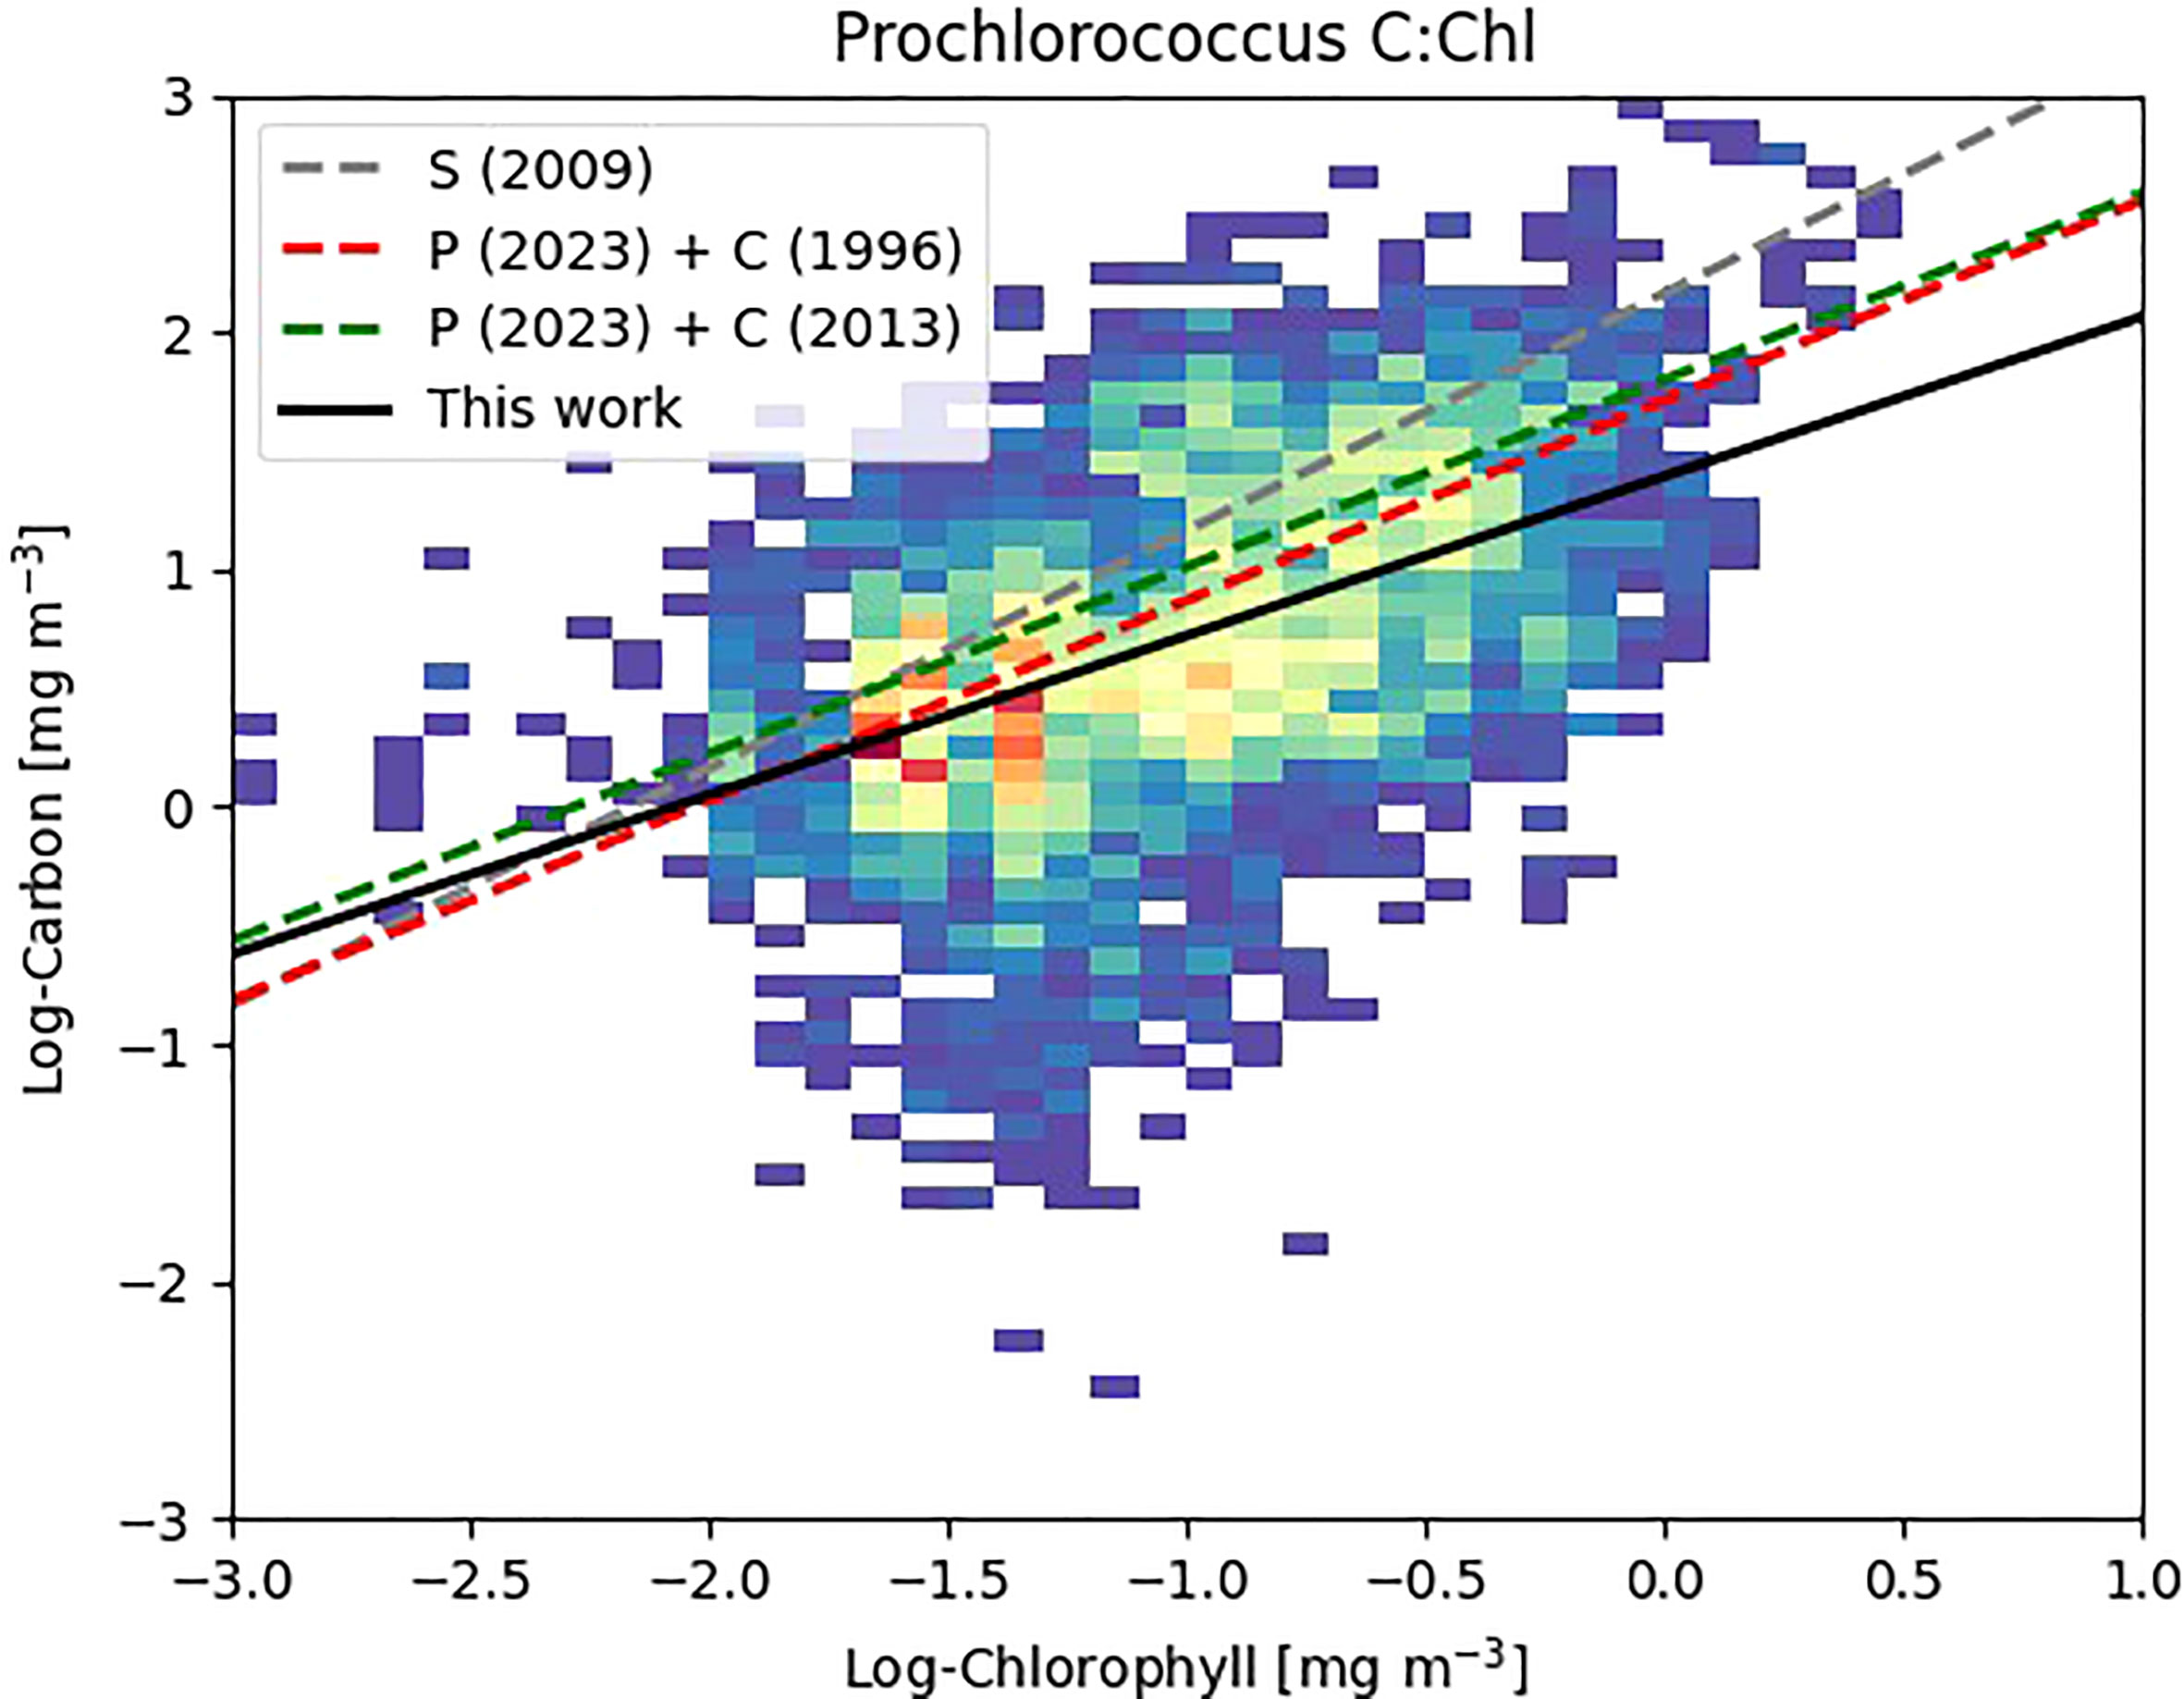
Figure 8 Density plot of Log Carbon vs. Log Chlorophyll for Prochlorococcus where Prochlorococcus >50% of the calculated chlorophyll content of the individual sample (Figure 2). Warmer colors denote greater number of data points. Previous literature values denoted as S (2009) - Sathyendranath et al. (2009); P (2023) + C (1996) - Phongphattarawat et al. (2023) using Cailliau et al. (1996); P (2023) + C (2013) - Phongphattarawat et al. (2023) using Casey et al. (2013).
Prochlorococcus is well known to have distinct adaptions to environmental factors such as light intensity, temperature and nutrient concentrations (Partensky et al., 1999) with well-defined ecotypes (Rocap et al., 2003; Zinser et al., 2006; Chandler et al., 2016) as well as remarkable genetic and physiological diversity (Rocap et al., 2003). Qualitatively Figure 4 shows such patterns with regards to scatter (dCsca/dΩ3, dCsca/dΩ4), carbon, nFl and C:Chl ratio. For the RF model results (Figures 5C, 6C, 7C), silicate is consistently shown to be an important variable for predicting C:Chl ranking first in the two gyres (Figures 6C, 7C) and third for all AMT ocean provinces (Figure 5C); however much of the Atlantic is deficient in silicate (Smyth et al., 2017) particularly at depths between 50 – 150 m. The SHAP value, which is a measure of impact, is negative (Figures 5D, 6D, 7D) which may reflect the silicate deficit.
Different Prochlorococcus ecotypes have been observed to use the nitrogen species that is most prevalent at the light levels to which they are best adapted which is ammonium in the surface waters and nitrite at depth (Rocap et al., 2003), which can explain why nitrite is a strong driver in predicting C:Chl (Figure 5C). There is also a species difference between Synechococcus and Prochlorococcus as to which nitrogen source is utilized (Moore et al., 2002) and it is known that some Prochlorococcus ecotypes are unable to use nitrate (Bouman et al., 2006) because of their lack of nitrate reductase (Rocap et al., 2003). However, there is evidence that some Prochlorococcus strains are able to utilize nitrate (Berube et al., 2015). This somewhat equivocal behaviour may explain why nitrate is not one of the dominant drivers of Prochlorococcus C:Chl (Figures 5–7).
The hemispheric nuances in predicting C:Chl (Figure 6 cf. Figure 7), particularly for some of the weaker predictor variables such as nitrate and phosphate (Figure 6C cf. Figure 7C), may be explicable by the wider inorganic nutrient stoichiometry of the Atlantic Ocean; and the known deficit (Redfield, 1958) of N:P which is particularly pronounced (Smyth et al., 2017) in the southern gyre. All these driving factors are manifested in the changing efficiencies in CO2 fixation by Prochlorococcus, which is already known to be highly efficient - (Hartmann et al., 2014).
Conclusion
Using flow-cytometry we have shown robust relationships between forward scatter and phytoplankton cellular carbon content, as well as between side scatter and a measure of chlorophyll content for cultures of multiple phytoplankton species. This appears to be robust across several orders of magnitude in scatter and is replicated, albeit with different calibration regression coefficients, for multiple instruments. When applied to the decadal time-scale AMT expeditions, the analysis revealed that Prochlorococcus cellular carbon and chlorophyll vary with depth and latitude throughout the Atlantic basin, with higher values encountered at the deep chlorophyll maximum (DCM). A machine learning analysis approach has revealed that the dominant drivers of the C:Chl ratio in the Atlantic basin are silicate and nitrite, with some hemispheric differences between the gyral provinces.
Measurement of phytoplankton carbon in natural oceanographic environments has been notoriously difficult, with many existing methods relying on per-cell carbon content for different phytoplankton cells estimated based on laboratory culture experiments, e.g., Phongphattarawat et al. (2023), or on expensive and labour-intensive ship-board measurements, e.g., Graff et al. (2015). The method developed here employs differences in the scattering properties of cells, which can account for intra-species and inter-species differences in per-cell scattering and is demonstrated to function across multiple models of flow cytometers. When combined with per-cell chlorophyll information, also derived from scattering properties, it became possible to study the natural variability in C:Chl ratio in the decade-long AMT database.
Despite the C:Chl ratio being a key parameter in ecosystem models (Blackford et al., 2004), as well as being widely used in satellite algorithms of productivity and photo-acclimation (Sathyendranath et al., 2009; Sathyendranath et al., 2020), it is still a relatively poorly-understood phytoplankton property. The methodology presented here allows the rapid assessment of C:Chl for a large number of samples over a wide range of biogeochemical provinces. This represents a significant step forward in progressing towards a convergence of species-specific values and variability in C:Chl, as well as the ratio’s controlling physical and biogeochemical factors.
Data availability statement
The raw data supporting the conclusions of this article will be made available by the authors, without undue reservation.
Author contributions
TS was the originator of the concept, wrote the original analysis code and led the writing of the manuscript. DM designed the Machine Learning approaches and produced the corresponding figures. GT generated the original AMT FACS datasets as well as the analysis of the laboratory cultures and was instrumental in developing the original concept of the study. FR carried out laboratory analysis of the phytoplankton cultures. TS, DM, GT, FR, JC, SS all contributed to the various iterations of the manuscript by giving intellectual insight and critical analysis. All authors contributed to the article and approved the submitted version.
Funding
This work was funded by the UK Natural Environment Research Council through its National Capability Long-term Single Centre Science Programme, Climate Linked Atlantic Sector Science, grant number NE/R015953/1, and is a contribution to the Atlantic Meridional Transect and Theme 1.3 – Biological Dynamics. This work was supported by the Simons Collaboration on Computational Biogeochemical Modeling of Marine Ecosystems/CBIOMES (Grant ID: 549947,SS).
Acknowledgments
This study contributes to the international IMBeR project and is contribution #396 of the AMT programme. The authors thank the NERC Earth Observation Data Acquisition and Analysis Service (NEODAAS) for access to compute resources for this study.
Conflict of interest
The authors declare that the research was conducted in the absence of any commercial or financial relationships that could be construed as a potential conflict of interest.
Publisher’s note
All claims expressed in this article are solely those of the authors and do not necessarily represent those of their affiliated organizations, or those of the publisher, the editors and the reviewers. Any product that may be evaluated in this article, or claim that may be made by its manufacturer, is not guaranteed or endorsed by the publisher.
Supplementary material
The Supplementary Material for this article can be found online at: https://www.frontiersin.org/articles/10.3389/fmars.2023.1191216/full#supplementary-material
References
Ackleson S. G., Spinrad R. W. (1988). Size and refractive-index of individual marine particulates - a flow cytometric approach. Appl. Optics 27 (7), 1270–1277. doi: 10.1364/ao.27.001270
Agagliate J., Rottgers R., Twardowski M. S., McKee D. (2018). Evaluation of a flow cytometry method to determine size and real refractive index distributions in natural marine particle populations. Appl. Optics 57 (7), 1705–1716. doi: 10.1364/ao.57.001705
Behrenfeld M. J., Boss E., Siegel D. A., Shea D. M. (2005). Carbon-based ocean productivity and phytoplankton physiology from space. Global Biogeochem. Cycles 19, GB1006. doi: 10.1029/2004GB002299
Berube P. M., Biller S. J., Kent A. G., Berta-Thompson J. W., Roggensack S. E., Roache-Johnson K. H., et al. (2015). Physiology and evolution of nitrate acquisition in prochlorococcus. ISME J. 9 (5), 1195–1207. doi: 10.1038/ismej.2014.211
Blackford J. C., Allen J. I., Gilbert F. J. (2004). Ecosystem dynamics at six contrasting sites: a generic modelling study. J. Mar. Sys. 52, 191–215. doi: 10.1016/j.jmarsys.2004.02.004
Bohren C. F., Huffman D. R. (1983). Absorption and scattering of light by small particles (New York: Wiley).
Bouman H. A., Ulloa O., Scanlan D. J., Zwirglmaier K., Li W. K. W., Platt T., et al. (2006). Oceanographic basis of the global surface distribution of Prochlorococcus ecotypes. Science 312 (5775), 918–921. doi: 10.1126/science.1122692
Bricaud A., Claustre H., Ras J., Oubelkheir K. (2004). Natural variability of phytoplanktonic absorption in oceanic waters: influence of the size structure of algal populations. J. Geophysical Research: Oceans 109 (C11). doi: 10.1029/2004JC002419
Burbage C. D., Binder B. J. (2007). Relationship between cell cycle and light-limited growth rate in oceanic prochlorococcus (MIT9312) and synechococcus (WH8103) (cyanobacteria). J. Phycology 43 (2), 266–274. doi: 10.1111/j.1529-8817.2007.00315.x
Cailliau C., Claustre H., Vidussi F., Marie D., Vaulot D. (1996). Carbon biomass, and gross growth rates as estimated from 14C pigment labelling, during photoacclimation in prochlorococcus CCMP 1378. Mar. Ecol. Prog. Ser. 145, 209–221. doi: 10.3354/meps145209
Casey J. R., Aucan J. P., Goldberg S. R., Lomas M. W. (2013). Changes in partitioning of carbon amongst photosynthetic pico- and nano-plankton groups in the Sargasso Sea in response to changes in the north Atlantic oscillation. Deep-Sea Res. Part Ii-Topical Stud. Oceanography 93, 58–70. doi: 10.1016/j.dsr2.2013.02.002
Casey J. R., Bjorkman K. M., Ferron S., Karl D. M. (2019). Size dependence of metabolism within marine picoplankton populations. Limnology Oceanography 64 (4), 1819–1827. doi: 10.1002/lno.11153
Chandler J. W., Lin Y. J., Gainer P. J., Post A. F., Johnson Z. I., Zinser E. R. (2016). Variable but persistent coexistence of prochlorococcus ecotypes along temperature gradients in the ocean's surface mixed layer. Environ. Microbiol. Rep. 8 (2), 272–284. doi: 10.1111/1758-2229.12378
Claustre H., Bricaud A., Babin M., Bruyant F., Guillou L., Le Gall F., et al. (2002). Diel variations in prochlorococcus optical properties. Limnology Oceanography 47, 1637–1647. doi: 10.2307/3096536
Collos Y., Mornet F., Sciandra A., Waser N., Larson A., Harrison P. J. (1999). An optical method for the rapid measurement of micromolar concentrations of nitrate in marine phytoplankton cultures. J. Appl. Phycology 11 (2), 179–184. doi: 10.1023/a:1008046023487
DuRand M. D., Green R. E., Sosik H. M., Olson R. J. (2002). Diel variations in optical properties of micromonas pusilla (Prasinophyceae). J. Phycology 38 (6), 1132–1142. doi: 10.1046/j.1529-8817.2002.02008.x
DuRand M. D., Olson R. J., Chisholm S. W. (2001). Phytoplankton population dynamics at the Bermuda Atlantic time-series station in the Sargasso Sea. Deep Sea Res. Part II: Topical Stud. Oceanography 48 (8), 1983–2003. doi: 10.1016/S0967-0645(00)00166-1
Garrison D. L., Gowing M. M., Hughes M. P., Campbell L., Caron D. A., Dennett M. R., et al. (2000). Microbial food web structure in the Arabian Sea: a US JGOFS study. Deep Sea Res. Part II: Topical Stud. Oceanography 47 (7), 1387–1422. doi: 10.1016/S0967-0645(99)00148-4
Geider R. J. (1987). Light and temperature-dependence of the carbon to chlorophyll-a ratio in microalgae and cyanobacteria - implications for physiology and growth of phytoplankton. New Phytol. 106 (1), 1–34. doi: 10.1111/j.1469-8137.1987.tb04788.x
Graff J. R., Westberry T. K., Milligan A. J., Brown M. B., Dall'Olmo G., van Dongen-Vogels V., et al. (2015). Analytical phytoplankton carbon measurements spanning diverse ecosystems. Deep-Sea Res. Part I-Oceanographic Res. Papers 102, 16–25. doi: 10.1016/j.dsr.2015.04.006
Green R. E., Sosik H. M., Olson R. J., DuRand M. D. (2003). Flow cytometric determination of size and complex refractive index for marine particles: comparison with independent and bulk estimates. Appl. Optics 42 (3), 526–541. doi: 10.1364/ao.42.000526
Grob C., Ulloa O., Claustre H., Huot Y., Alarcón G., Marie D. (2007). Contribution of picoplankton to the total particulate organic carbon concentration in the eastern south pacific. Biogeosciences 4 (5), 837–852. doi: 10.5194/bg-4-837-2007
Guillard R. R. L., Smith W. L., Chanley M. H. (1975). “Culture of phytoplankton for feeding marine invertebrates,” in Culture of marine invertebrate animals. Eds. Smith W. L., Chanley M. H. (New York: Plenum Press), 29–60.
Hartmann M., Gomez-Pereira P., Grob C., Ostrowski M., Scanlan D. J., Zubkov M. V. (2014). Efficient CO2 fixation by surface prochlorococcus in the Atlantic ocean. ISME J. 8 (11), 2280–2289. doi: 10.1038/ismej.2014.56
Jakobsen H. H., Markager S. (2016). Carbon-to-chlorophyll ratio for phytoplankton in temperate coastal waters: seasonal patterns and relationship to nutrients. Limnology Oceanography 61 (5), 1853–1868. doi: 10.1002/lno.10338
Jassby A. D., Platt T. (1976). Mathematical formulation of the relationship between photosynthesis and light for phytoplankton. Limnology Oceanography 21 (4), 540–547. doi: 10.4319/lo.1976.21.4.0540
Johnson Z. I., Zinser E. R., Coe A., McNulty N. P., Woodward E. M. S., Chisholm S. W. (2006). Niche partitioning among prochlorococcus ecotypes along ocean-scale environmental gradients. Science 311 (5768), 1737–1740. doi: 10.1126/science.1118052
Landry M. R., Kirchman D. L. (2002). Microbial community structure and variability in the tropical pacific. Deep Sea Res. Part II: Topical Stud. Oceanography 49 (13), 2669–2693. doi: 10.1016/S0967-0645(02)00053-X
Longhurst A., Sathyendranath S., Platt T., Caverhill C. (1995). An estimate of global primary production in the ocean from satellite radiometer data. J. Plankton Res. 17 (6), 1245–1271. doi: 10.1093/plankt/17.6.1245
Lundberg S. M., Lee S. I. (2017). “A unified approach to interpreting model predictions,” in 31st annual conference on neural information processing systems (NIPS)(57 Morehouse Lane, Hook, NY, United States: Curran Associates Inc.).
Marie D., Rigaut-Jalabert F., Vaulot D. (2014). An improved protocol for flow cytometry analysis of phytoplankton cultures and natural samples. Cytometry Part A 85 (11), 962–968. doi: 10.1002/cyto.a.22517
Menden-Deuer S., Lessard E. J. (2000). Carbon to volume relationships for dinoflagellates, diatoms, and other protist plankton. Limnology Oceanography 45 (3), 569–579. doi: 10.4319/lo.2000.45.3.0569
Mie G. (1908). Contribution to the optical properties of turbid media, in particular of colloidal suspensions of metals. Ann. Phys. (Leipzig) 25, 377–452. doi: 10.1002/andp.19083300302
Moore L. R., Coe A., Zinser E. R., Saito M. A., Sullivan M. B., Lindell D., et al. (2007). Culturing the marine cyanobacterium prochlorococcus. Limnology Oceanography: Methods 5 (10), 353–362. doi: 10.4319/lom.2007.5.353
Moore L. R., Goericke R., Chisholm S. W. (1995). Comparative physiology of synechococcus and prochlorococcus: influence of light and temperature on growth, pigments, fluorescence and absorptive properties. Mar. Ecol. Prog. Ser. 116 (1/3), 259–275. doi: 10.3354/meps116259
Moore L. R., Post A. F., Rocap G., Chisholm S. W. (2002). Utilization of different nitrogen sources by the marine cyanobacteria prochlorococcus and synechococcus. Limnology Oceanography 47 (4), 989–996. doi: 10.4319/lo.2002.47.4.0989
Olson R. J., Shalapyonok A., Kalb D. J., Graves S. W., Sosik H. M. (2017). Imaging FlowCytobot modified for high throughput by in-line acoustic focusing of sample particles. Limnology Oceanography-Methods 15 (10), 867–874. doi: 10.1002/lom3.10205
Pallon J., Elfman M., Kristiansson P., Malmqvist K., Graneli E., Sellborn A., et al. (1999). Elemental analysis of single phytoplankton cells using the Lund nuclear microprobe. Nucl. Instruments Methods Phys. Res. Section B-Beam Interact. Materials Atoms 158 (1-4), 312–316. doi: 10.1016/s0168-583x(99)00372-9
Partensky F., Hess W. R., Vaulot D. (1999). Prochlorococcus, a marine photosynthetic prokaryote of global significance. Microbiol. Mol. Biol. Rev. 63 (1), 106–127. doi: 10.1128/MMBR.63.1.106-127.1999
Phongphattarawat S., Bouman H. A., Lomas M. W., Sathyendranath S., Tarran G. A., Ulloa O., et al. (2023). Ecophysiological basis of spatiotemporal patterns in picophytoplankton pigments in the global ocean. Front. Mar. Sci. 10. doi: 10.3389/fmars.2023.1112177
Redfield A. C. (1958). The biological control of chemical factors in the environment. Am. Sci. 46 205–221. doi: 10.1002/bmb.20717
Rees A. P., Nightingale P. D., Poulton A. J., Smyth T. J., Tarran G. A., Tilstone G. H. (2017). The Atlantic meridional transect programme (1995-2016). Prog. Oceanography 158, 3–18. doi: 10.1016/j.pocean.2017.05.004
Ribalet F., Berthiaume C., Hynes A., Swalwell J., Carlson M., Clayton S., et al. (2019). SeaFlow data v1, high-resolution abundance, size and biomass of small phytoplankton in the north pacific. Sci. Data 6. doi: 10.1038/s41597-019-0292-2
Riemann B., Simonsen P., Stensgaard L. (1989). The carbon and chlorophyll content of phytoplankton from various nutrient regimes. J. Plankton Res. 11 (5), 1037–1045. doi: 10.1093/plankt/11.5.1037
Rocap G., Distel D. L., Waterbury J. B., Chisholm S. W. (2002). Resolution of prochlorococcus and synechococcus ecotypes by using 16S-23S ribosomal DNA internal transcribed spacer sequences. Appl. Environ. Microbiol. 68 (3), 1180–1191. doi: 10.1128/AEM.68.3.1180-1191.2002
Rocap G., Larimer F. W., Lamerdin J., Malfatti S., Chain P., Ahlgren N. A., et al. (2003). Genome divergence in two prochlorococcus ecotypes reflects oceanic niche differentiation. Nature 424 (6952), 1042–1047. doi: 10.1038/nature01947
Sathyendranath S., Platt T., Kovac Z., Dingle J., Jackson T., Brewin R. J. W., et al. (2020). Reconciling models of primary production and photoacclimation invited. Appl. Optics 59 (10), C100–C114. doi: 10.1364/ao.386252
Sathyendranath S., Stuart V., Nair A., Oka K., Nakane T., Bouman H., et al. (2009). Carbon-to-chlorophyll ratio and growth rate of phytoplankton in the sea. Mar. Ecol. Prog. Ser. 383, 73–84. doi: 10.3354/meps07998
Shalapyonok A., Olson R. J., Shalapyonok L. S. (2001). Arabian Sea Phytoplankton during southwest and northeast monsoons 1995: composition, size structure and biomass from individual cell properties measured by flow cytometry. Deep Sea Res. Part II: Topical Stud. Oceanography 48 (6), 1231–1261. doi: 10.1016/S0967-0645(00)00137-5
Smyth T., Quartly G., Jackson T., Tarran G., Woodward M., Harris C., et al. (2017). Determining Atlantic ocean province contrasts and variations. Prog. Oceanography 158, 19–40. doi: 10.1016/j.pocean.2016.12.004
Smyth T. J., Tarran G. A., Sathyendranath S. (2019). Marine picoplankton size distribution and optical property contrasts throughout the Atlantic ocean revealed using flow cytometry. Appl. Optics 58 (32), 8802–8815. doi: 10.1364/ao.58.008802
Smyth T. J., Tarran G. A., Sathyendranath S. (2021). Sub-Micron picoplankton shape, orientation, and internal structure combined to preferentially amplify the forward scatter. Optics Express 29 (2), 2014–2024. doi: 10.1364/OE.413576
Stramski D. (1999). Refractive index of planktonic cells as a measure of cellular carbon and chlorophyll a content. Deep-Sea Res. Part I-Oceanographic Res. Papers 46 (2), 335–351. doi: 10.1016/s0967-0637(98)00065-x
Tarran G. A., Heywood J. L., Zubkov M. V. (2006). Latitudinal changes in the standing stocks of eukaryotic nano- and picophytoplankton in the Atlantic ocean. Deep-Sea Res. II 53, 1516–1529. doi: 10.1016/j.dsr2.2006.05.004
Thomas M. K., Fontana S., Reyes M., Pomati F. (2018). Quantifying cell densities and biovolumes of phytoplankton communities and functional groups using scanning flow cytometry, machine learning and unsupervised clustering. PloS One 13 (5). doi: 10.1371/journal.pone.0196225
Ting C., Hsieh C., Sundararaman S., Mannella C., Marko M. (2007). Cryo-electron tomography reveals the comparative three-dimensional architecture of prochlorococcus, a globally important marine cyanobacterium. J. bacteriology 189, 4485–4493. doi: 10.1128/JB.01948-06
Veldhuis M. J. W., Kraay G. W. (2004). Phytoplankton in the subtropical Atlantic ocean: towards a better assessment of biomass and composition. Deep Sea Res. Part I: Oceanographic Res. Papers 51 (4), 507–530. doi: 10.1016/j.dsr.2003.12.002
Volk T., Hoffert M. I. (1985). Ocean carbon pumps: analysis of relative strengths and efficiencies in ocean-driven atmospheric CO2 changes. Carbon Cycle Atmospheric CO2: Natural Variations Archean to Present 99–110. doi: 10.1029/GM032p0099
Welschmeyer N. A. (1994). Fluorometric analysis of chlorophyll-a in the presence of chlorophyll-b and pheopigments. Limnology Oceanography 39 (8), 1985–1992. doi: 10.4319/lo.1994.39.8.1985
Worden A. Z., Nolan J. K., Palenik B. (2004). Assessing the dynamics and ecology of marine picophytoplankton: the importance of the eukaryotic component. Limnology Oceanography 49 (1), 168–179. doi: 10.4319/lo.2004.49.1.0168
Keywords: flow cytometry, carbon, chlorophyll, machine learning, random forests, Atlantic Ocean, phytoplankton, physiology
Citation: Smyth T, Moffat D, Tarran G, Sathyendranath S, Ribalet F and Casey J (2023) Determining drivers of phytoplankton carbon to chlorophyll ratio at Atlantic Basin scale. Front. Mar. Sci. 10:1191216. doi: 10.3389/fmars.2023.1191216
Received: 21 March 2023; Accepted: 26 June 2023;
Published: 11 July 2023.
Edited by:
Takafumi Hirata, Hokkaido University, JapanReviewed by:
James Fox, Oregon State University, United StatesAnne W. Thompson, Portland State University, United States
Copyright © 2023 Smyth, Moffat, Tarran, Sathyendranath, Ribalet and Casey. This is an open-access article distributed under the terms of the Creative Commons Attribution License (CC BY). The use, distribution or reproduction in other forums is permitted, provided the original author(s) and the copyright owner(s) are credited and that the original publication in this journal is cited, in accordance with accepted academic practice. No use, distribution or reproduction is permitted which does not comply with these terms.
*Correspondence: Timothy Smyth, tjsm@pml.ac.uk