Download the Briefing Paper
Modelling the Impact of Brexit on Manufacturing
At the start of 2016, the UK was home to 5.5 million businesses providing employment to some 26 million people.[1] Among these, manufacturing accounted for 5% of businesses, 10% of employment and 15% of turnover. Overall, manufacturing contributed £169 billion, almost exactly 10%, to the total Gross Value Added (GVA) of £1,685 billion for the UK economy.[2]
In this paper, we examine which UK manufacturing sectors may be most vulnerable to Brexit measured by the effects on output, trade and prices. We do this in much greater sectoral detail than has been done before, by assessing the possible effects of Brexit for 122 UK manufacturing sectors. Our analysis is based on partial equilibrium modelling in which we consider the possible effects of Brexit on each sector separately.
The analysis focusses on the trade relationships between the UK and three groups of countries:
For the 122 manufacturing sectors, we examine the exposure of these sectors to different possible Brexit scenarios. These scenarios depend on:
In all cases, we find that introducing tariff and non-tariff barriers raises prices for UK consumers and producers, and leads to reduced UK exports. For a few sectors, the increase in protection leads to higher UK output, but for most sectors, output falls. The negative impact on output is greater for high and medium-high tech sectors than medium or medium-low tech sectors. This has implications for the Government’s Industrial Strategy, which aims to support economic growth and drive productivity through R&D and innovation.
It should be emphasised at the start of this paper that we are not making ‘predictions’ about the precise sectoral effects of Brexit. Rather we are drawing attention to the ways that the existing structure of trade, together with reasonable assumptions about changes in trade barriers, means that Brexit is likely to have different effects in different sectors. We are also showing that different policy scenarios may have radically different effects on manufacturing. To move from the kind of prima facie concerns which our analysis highlights to more definite predictions would require deeper sector-specific analysis, for example consideration of the impact of border inspections on supply chains, or the specific nature of regulatory differences affecting specific sectors.
This paper is a first step in numerical modelling of the effects of Brexit at a detailed sectoral level, not the last word.
Manufacturing represents (just) 10% of the British economy but it accounts for a higher proportion of trade than of GVA or employment: in 2016 exports of semi-manufactured and finished manufactured goods accounted for 80% of UK’s goods exports, and 44% of UK’s total exports.[3] Nearly half of the UK’s exports of goods were destined to the EU, a further 15% went to the FTA67 countries, with 4% out of the 15% going to the European Free Trade Association (EFTA) countries (Iceland, Liechtenstein, Norway and Switzerland). On the import side, 55% of goods imports came from the EU27, 16% from the FTA67 countries, with 6% out of the 16% coming from the EFTA countries. Table 1 shows which sectors have the largest values of international trade.
Table 1: UK’s largest export and import manufacturing sectors
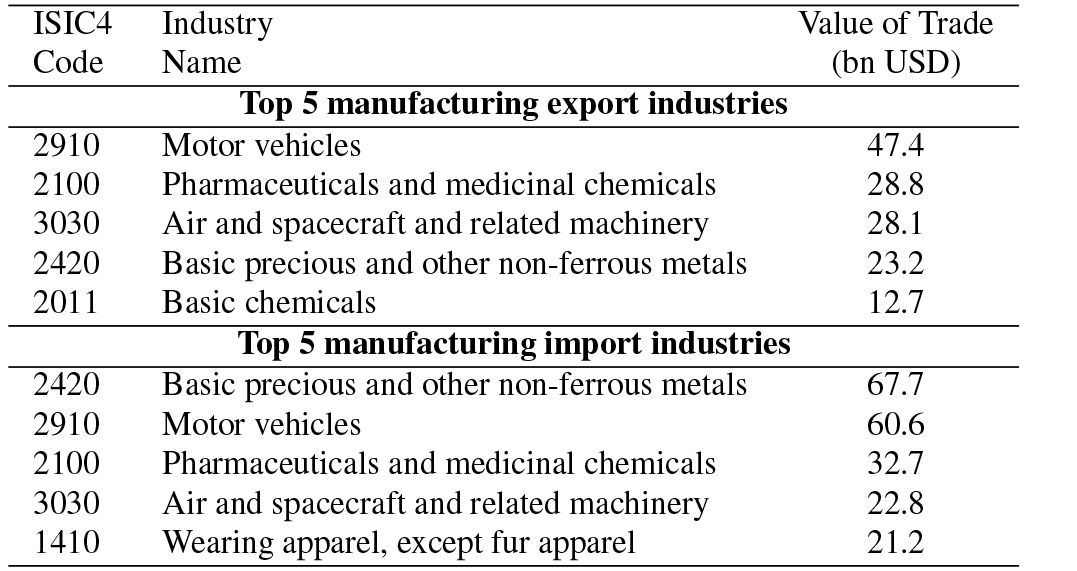
Table 2: UK’s manufacturing sectors most dependent on trade with the EU
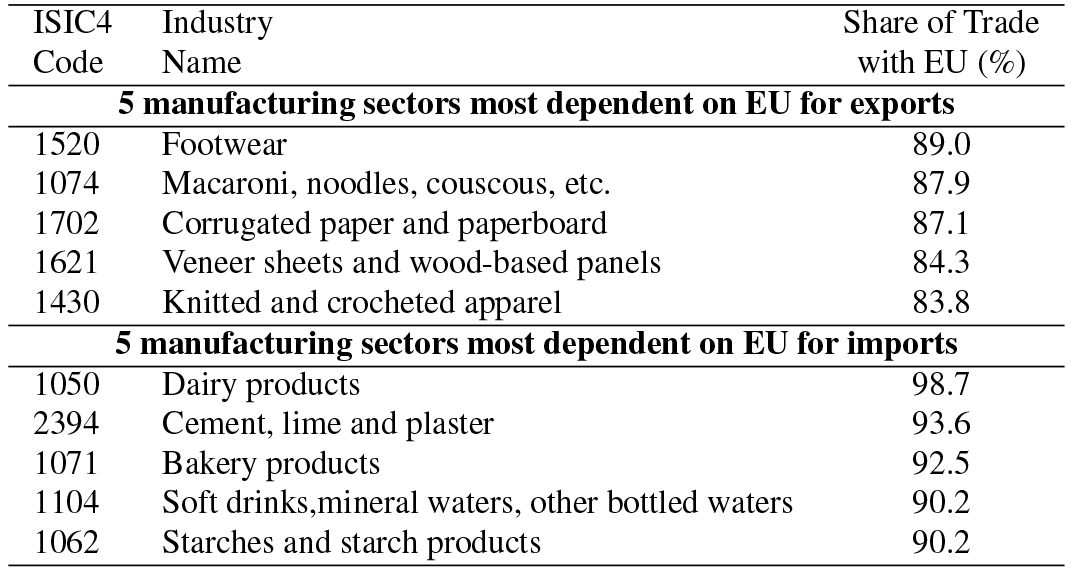
Manufacturing sectors differ in their share of trade with the EU. Where this is highest – see Table 2 for the most exposed sectors – we would expect vulnerability to be correspondingly high. This is one of the key issues which we explore in this paper.
With manufacturing making a large contribution to the UK’s international trade (and many manufacturing firms often involved with the EU) Brexit is likely to have widespread and far reaching implications for the manufacturing industry. In turn this will have a differential regional impact depending on which goods are produced where, and how much is traded with the EU by each region.
To explore which places are most dependent on manufacturing, in Figure 1 we show manufacturing employment as a proportion of the economically active population in 380 local authority districts across Great Britain.[4]
Of the 380 local authority districts, Copeland is the most dependent on manufacturing for employment, with some 12,000 thousand people – or 40% of the economically active population – employed in manufacturing.[5] Other areas with more than 25% of the economically active population employed in manufacturing are Fylde, Flintshire, Barrow-in-Furness, Ribble Valley and Corby.
Many of the areas where manufacturing provides fewer jobs in the local economy are in the Greater South East. For example, in Epsom and Ewell, Lewisham, Lambeth, and Wandsworth (all of which are located inside the M25), those employed in manufacturing account for less than 1% of the economically active population.
In absolute levels of employment, the manufacturing sector is largest in Birmingham (39,000 people employed in manufacturing), and high also in Leeds, Derby and County Durham (25,000 or more).
Figure 1. Manufacturing employment per 100,000 economically active population across Local Authority Districts in 2016
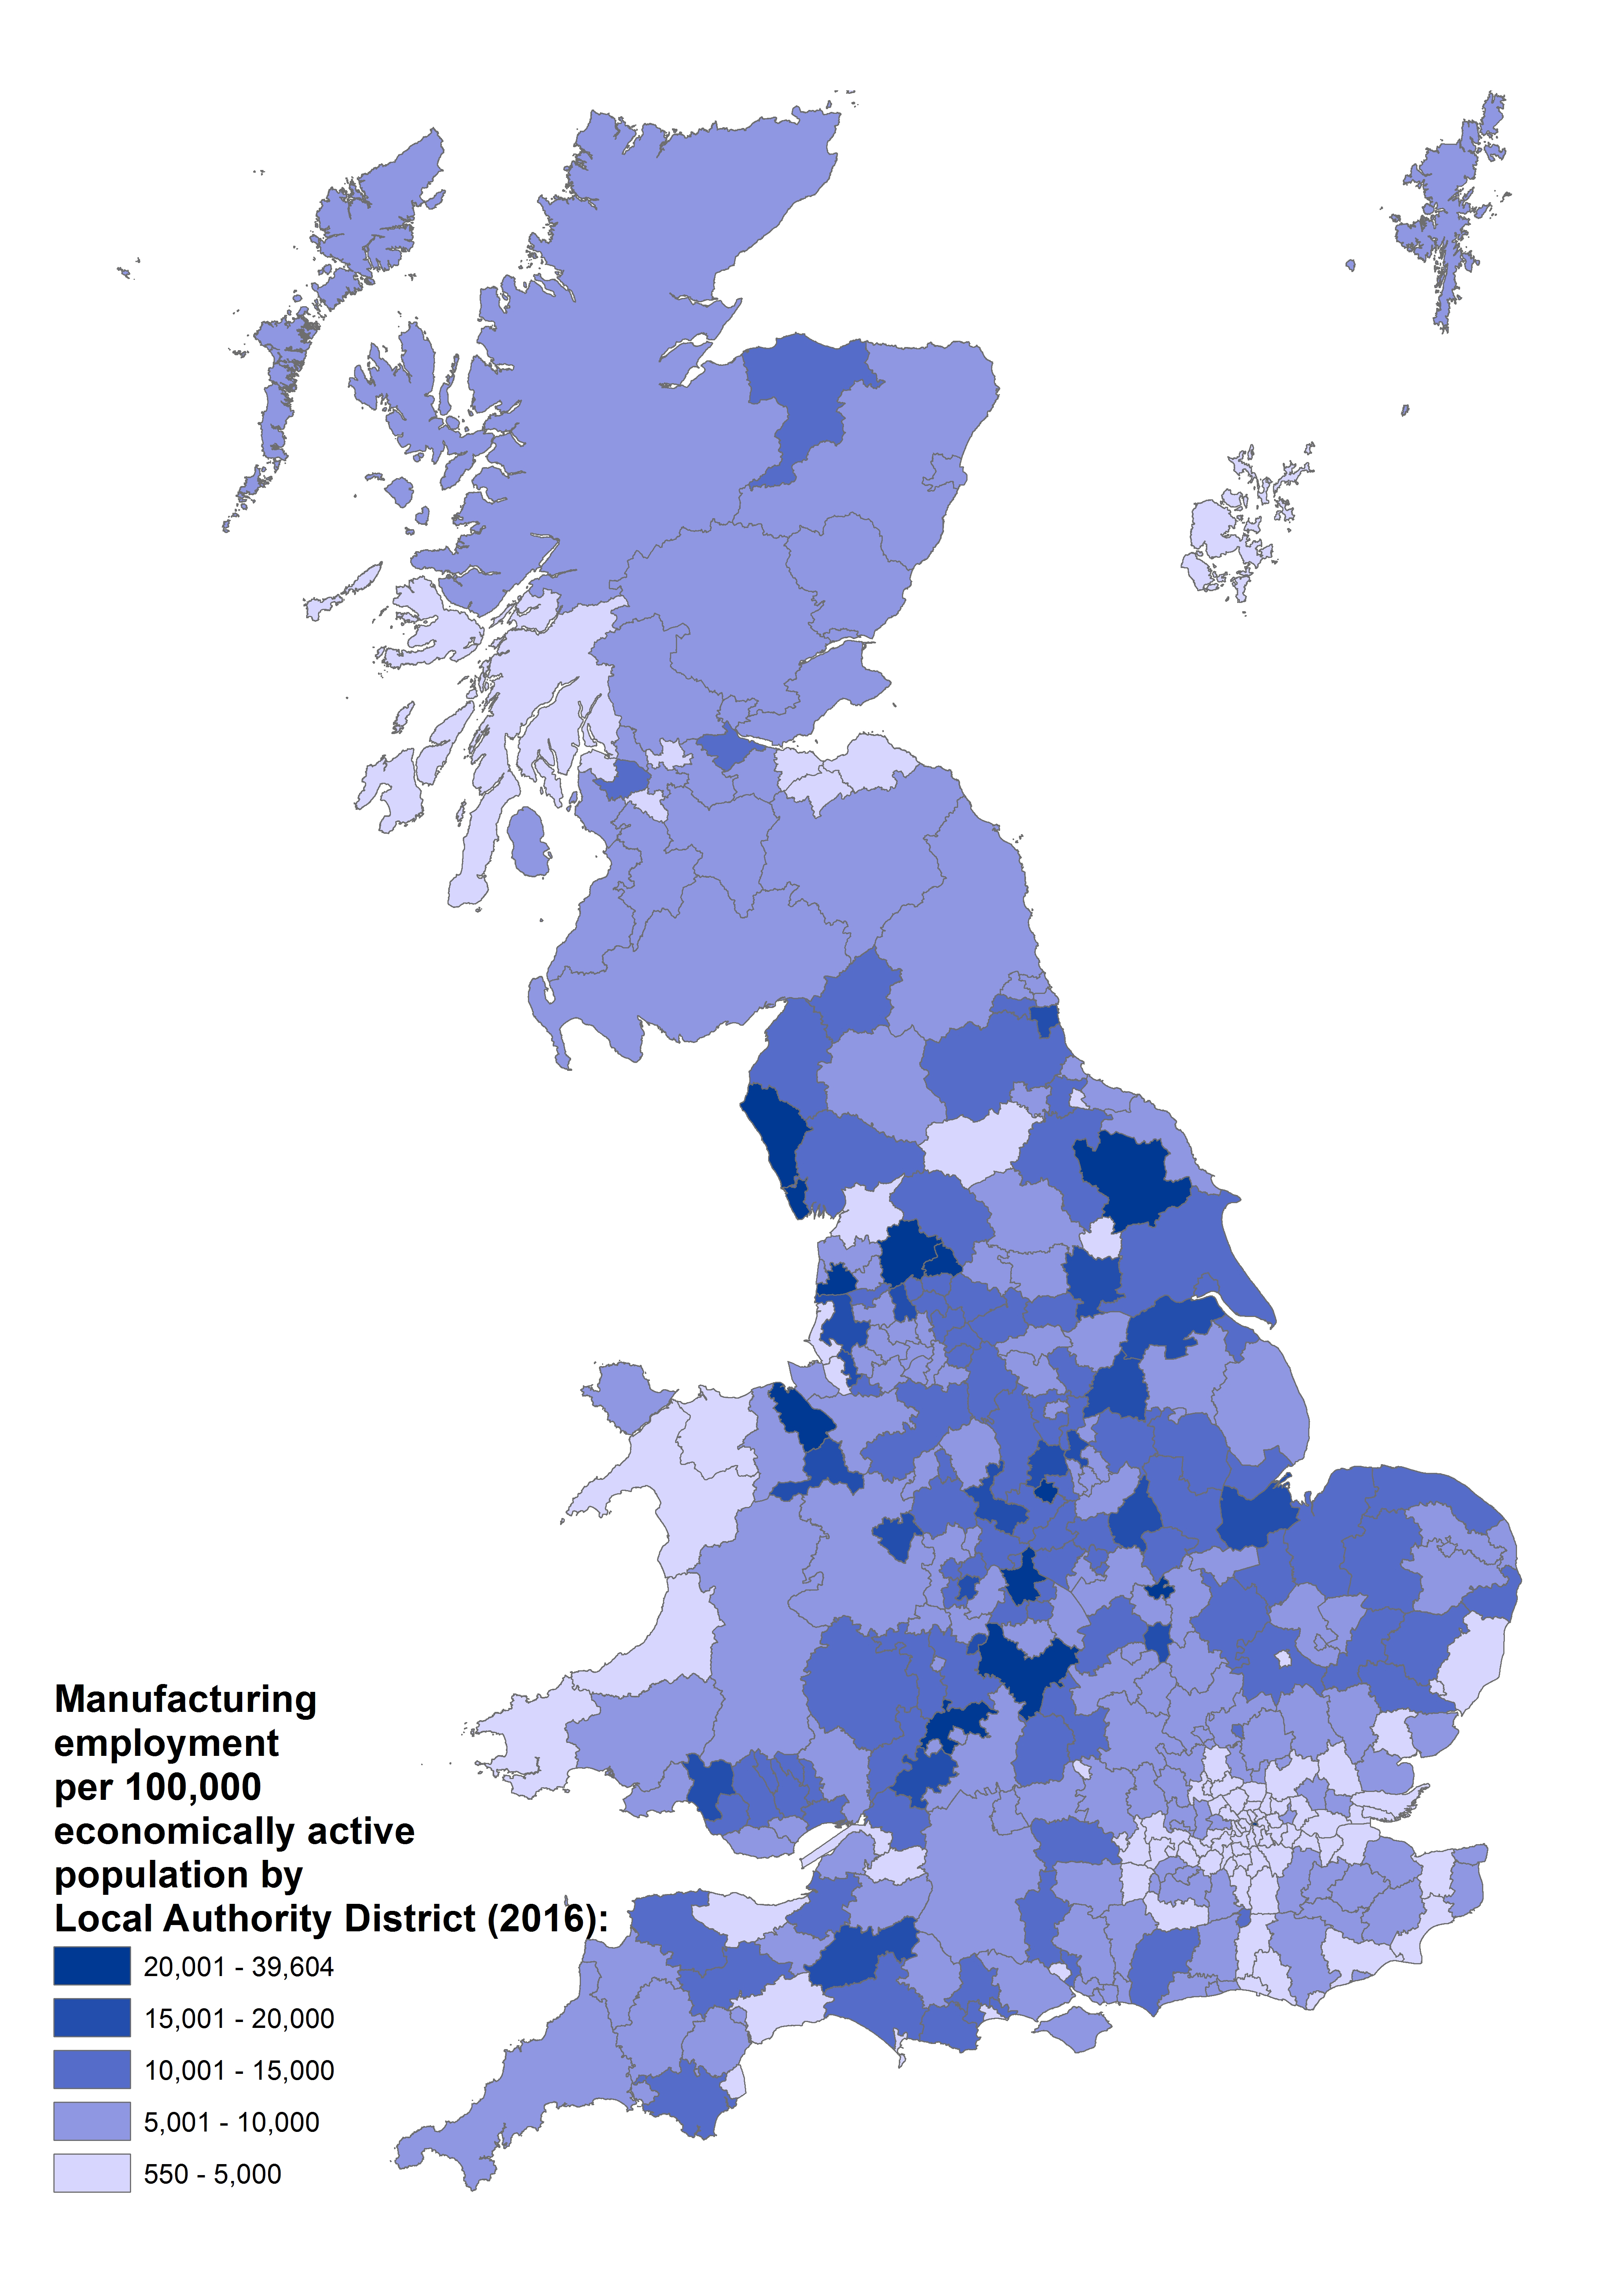
Source: Business Register and Employment Survey, 2016; Annual Population Survey, 2016; Ordance Survey Boundary-Line
The analysis in this paper is based on a partial equilibrium model of the impact of Brexit on prices, exports, imports and output in 122 manufacturing sectors. The data that the model uses are classified to 122 sectors (4-digit classes of ISIC Revision 4). We consider the possible effects of Brexit on each sector separately. The model has a multi-market structure, and in our analysis it features four markets: the UK, the remaining 27 members of the EU, the 67 countries with which the EU has signed Free Trade Agreements (FTA67), and the remaining countries in the rest of the world (ROW).
The economic model underlying our analysis is based on the assumption that products are differentiated by place of production, so that the product varieties produced in different countries and by different firms are imperfect substitutes for each other. The demand for any product is allocated across varieties from different sources according to a constant elasticity of substitution (CES) utility function. This means that the consumers have a ‘love of variety’ in any one product: wine drinkers like wine from Spain, and also wine from Australia. Throughout this paper, we assume that the imperfect substitutability of different firms’ product varieties gives rise to imperfect competition, in which firms have market power and set prices above marginal cost. Increasing returns mean that growth in a firm’s sales in one market reduces its cost of production and leads to expansion in other markets too. We also ran simulations using the standard Armington version of the partial equilibrium model, in which individual firms do not have market power. This model variant gave qualitatively similar results.[6]
In contrast to other approaches of modelling policy changes affecting many sectors (most notably, computable general equilibrium, CGE, models), a partial equilibrium approach has the advantage that it models the impact of a shock at a much more disaggregated and granular level. This is important for modelling the impact of Brexit on different sectors of the economy, as there may be some very sector-specific characteristics that lead to some sectors being affected very differently to others.
There are, however, some limitations to the partial equilibrium approach. We do not consider, for example, indirect effects of changes in employment in some sectors affecting other sectors through their impact on wages. Similarly, we do not consider how some sectors might be affected by changes in their supplying industries – how Brexit’s effects on UK agriculture might feed through to the food manufacturing industry; or how effects on the motor vehicle components sector could affect the car industry. Further we do not take into account other economic policies that might be introduced to mitigate any of the effects, for example, as part of the government’s Industrial Strategy, nor can we model other changes in the world economy which may impact on trade. As we noted at the start of the paper, we are not making ‘predictions’ about the precise sectoral effects of Brexit. Our modelling aims to provide a consistent framework for evaluating the orders of magnitude of the direct effects on manufacturing from different possible Brexit scenarios. This enables comparison across industries and across scenarios; and it may identify particular sectors giving rise to prima facie concerns, on which further sector-specific research might be justified.
Before we turn to modelling the impact of Brexit on manufacturing sectors, it is worth (briefly) situating our work and results in the context of other Brexit-related impact work.
There are a range of studies that have been undertaken estimating the possible impact of different Brexit scenarios. Some of these were done prior to the referendum itself (such as the work undertaken by Ottaviano et. al, 2014; Ciurak et. al, 2015; and the HM Treasury, 2016); as well as more recently such as the work of Ebell and Warren (2016); Dhingra et. al (2016); and Ries et. al (2017).
The typical methods are to use either a ‘gravity model’ framework or a computable general equilibrium (CGE) model. The former is typically applied to aggregate trade, and in the context of Brexit has not been applied to detailed sectoral level analysis. The latter models all sectors of the economy as well as interdependencies between them simultaneously. For an overall assessment of the economic impact this is important; policy changes in one sector will change prices faced by producers and consumers, and this is likely to have knock-on effects on other sectors. In order to run a CGE model, therefore, information is needed on the input-output linkages between all of the sectors, and on demands of each of the sectors for factors of production. But such information is typically only available at a relatively high degree of aggregation, making CGE models unsuitable for highly granular analysis.
In contrast, the work we present here is based on a partial equilibrium modelling approach. The advantage of this approach is that it allows for a much more disaggregated analysis of changes in trade policy. In this paper, we have 122 manufacturing sectors.
Looking a little ahead at our results, we find that in the ‘no deals’ Brexit scenario the average impact on output and exports are declines of 5.5% and 19.5% respectively. Broadly speaking these are similar orders of magnitude to the findings of the studies discussed above. But there is a very significant difference: our results indicate considerable heterogeneity across sectors, driven by different structural characteristics and by different levels of tariffs and non-tariff barriers. To understand the impact on industries it is important to understand and model that heterogeneity.
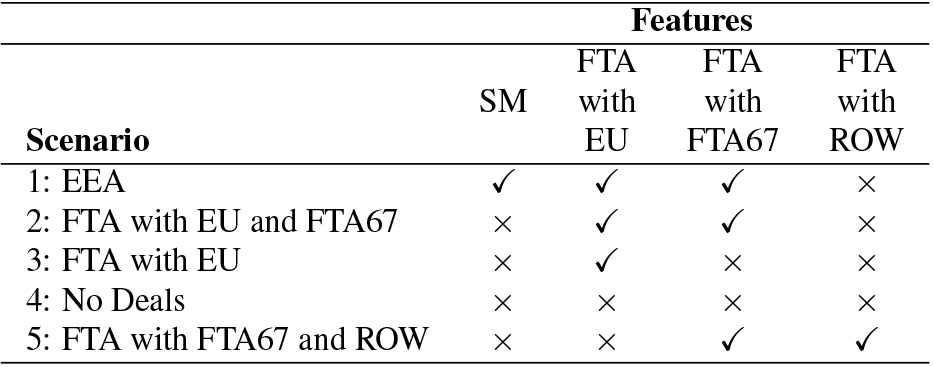
Using the partial equilibrium multi-market simulation model, we model the impact of Brexit on 122 manufacturing sectors under five different possible Brexit scenarios. These range from the ‘EEA’ membership scenario (which most resembles the status quo) to the ‘hardest’ ‘no deals’ scenario, in which the UK leaves the EU with no FTA, fails to roll over (grandfather) the EU’s existing FTAs, and does not sign any new trade deals. The in-between scenarios involve an FTA between the UK and at least one partner. All five of our Brexit scenarios involve the UK leaving the Customs Union, and all involve some change in the level of trade costs: change in the cost of border inspections, change in tariffs, change in Non-Tariff Measures (NTMs) (or a combination of these). The scenarios are modelled as follows:
This is our ‘softest’ Brexit scenario, where we assume that the UK leaves the EU Customs Union (CU), but has a Free Trade Agreement (FTA) with the EU, keeps full membership of the Single Market, and rolls over the existing EU FTAs with 67 countries. Leaving the CU would entail increased border inspections, for example in order to check whether goods being imported into the EU from the UK are UK goods covered by the FTA or non-UK goods which may be subject to EU tariffs. Based on secondary literature, such as CEPR (2013), Francois et al. (2013), Carrere and de Melo (2004), Anson et al. (2005), Cadot et al. (2005) and Hayakawa (2011), we have assumed that border inspections would increase trade costs between the UK and the EU by 3.5%. All other trade costs between the UK and other countries are unchanged. This increase in trade costs between the UK and the EU is then included in all subsequent experiments.
In this scenario the UK is again assumed to leave the CU, and in addition leaves the Single Market. However, it signs an FTA with the EU, which results in bilateral tariffs with EU being zero. Leaving the Single Market increases the non-tariff related cost of UK-EU trade, for example because of the need for conformity assessments. We model this by assuming that non-tariff barriers increase. We take the estimates of NTMs from Cadot and Gourdon (2016), who estimate these NTMs for 21 HS sections. Conveniently, Cadot and Gourdon distinguish between NTM costs between countries within an FTA and between those not part of an FTA. Hence, for UK-EU trade we take their lower FTA-inclusive estimates.[7] As before, we assume that the costs of trade between the UK and non-EU countries do not change.
Here we replicate the previous scenario, except we assume that the UK does not roll over existing EU FTAs to which it is a party as an EU member. We model this by assuming that the UK and the 67 countries which had an FTA with the EU in 2016 apply ‘Most Favoured Nation’ (MFN) tariffs on each other’s imports. In addition, NTMs rise under this scenario: from zero to low for UK-EU trade (as in the previous scenario), and from low to high for UK trade with the FTA partners.
For this scenario we assume that there is no trade agreement between the UK and the EU and no rolling-over of the EU’s FTAs to the UK; hence, it trades on World Trade Organisation (WTO) terms with all countries. The UK and the EU apply MFN tariffs on each other’s imports, with the UK assumed to adopt the current EU28 tariff schedules. We also assume an increase in NTMs under this scenario as given by the Cadot and Gourdon higher non-FTA estimates.
The preceding four scenarios model successive reductions in the UK’s access to EU and EU-partner markets. In this scenario, we assess the extent to which the impact of reductions in access to the EU market could be offset by the UK signing free trade agreements with third countries. We therefore assume ‘no EU deal’ (as in Scenario 4), but now assume that the UK signs FTAs with all non-EU countries. This involves rolling over existing EU FTAs and agreeing new FTAs with all other countries with which the EU does not currently have such agreements. This is a generous modelling of the potential of the UK to make new trade deals with non-EU countries after Brexit. As the data shows that existing EU FTAs do not reduce duties on all tariff lines to zero, we model this scenario as a reduction in the UK tariffs on imports from the rest of the world (ROW) to the level currently applied on imports from the FTA67 countries, and a reduction in the ROW tariff on imports from the UK to the level applied by the FTA countries.[8] These new global trade deals are also assumed to imply a reduction in NTMs.
Table 3 displays the features of our five Brexit scenarios.
In our modelling, we use the effectively applied (AHS) tariffs, which include both ad-valorem tariffs and specific duties. The latter are converted to ad-valorem equivalent tariffs.[9] This conversion of specific duties to ad-valorem equivalents, while intended to capture the true degree of protection, entails some approximation. For example, as it uses average import prices this may lead to some over-statement of the ad-valorem equivalent of the tariff for (high-cost) EU suppliers. However, as some sectors (notably, the food sector) use specific duties more than other, excluding these ad-valorem equivalents would lead to an underestimate of the degree of protection in certain sectors and probably a significant misrepresentation of the true likely impact of Brexit on these.
Table 3: Comparison of five Brexit scenarios
Before looking at how Brexit might affect different manufacturing sectors individually, we first set out the ‘average’ impact of Brexit across all sectors for each of the scenarios, where we focus on prices, exports, imports and output.
In broad terms, Figure 2 shows that as we step through Scenarios 1, 2 and 4, from ‘softer’ to ‘harder’ versions of Brexit, the negative impacts on UK manufacturing increase in more or less equal steps. There’s a relatively small step between Scenarios 2 and 3: rolling over the existing EU FTAs with the FTA67 has a relatively modest effect. In a similar vein, the improbable achievement of FTAs with every single country outside the EU (Scenario 5) would only partially mitigate the effects of having no FTA with the EU.
Figure 2: How different Brexit scenarios will impact on prices, exports, imports and output in the manufacturing sector
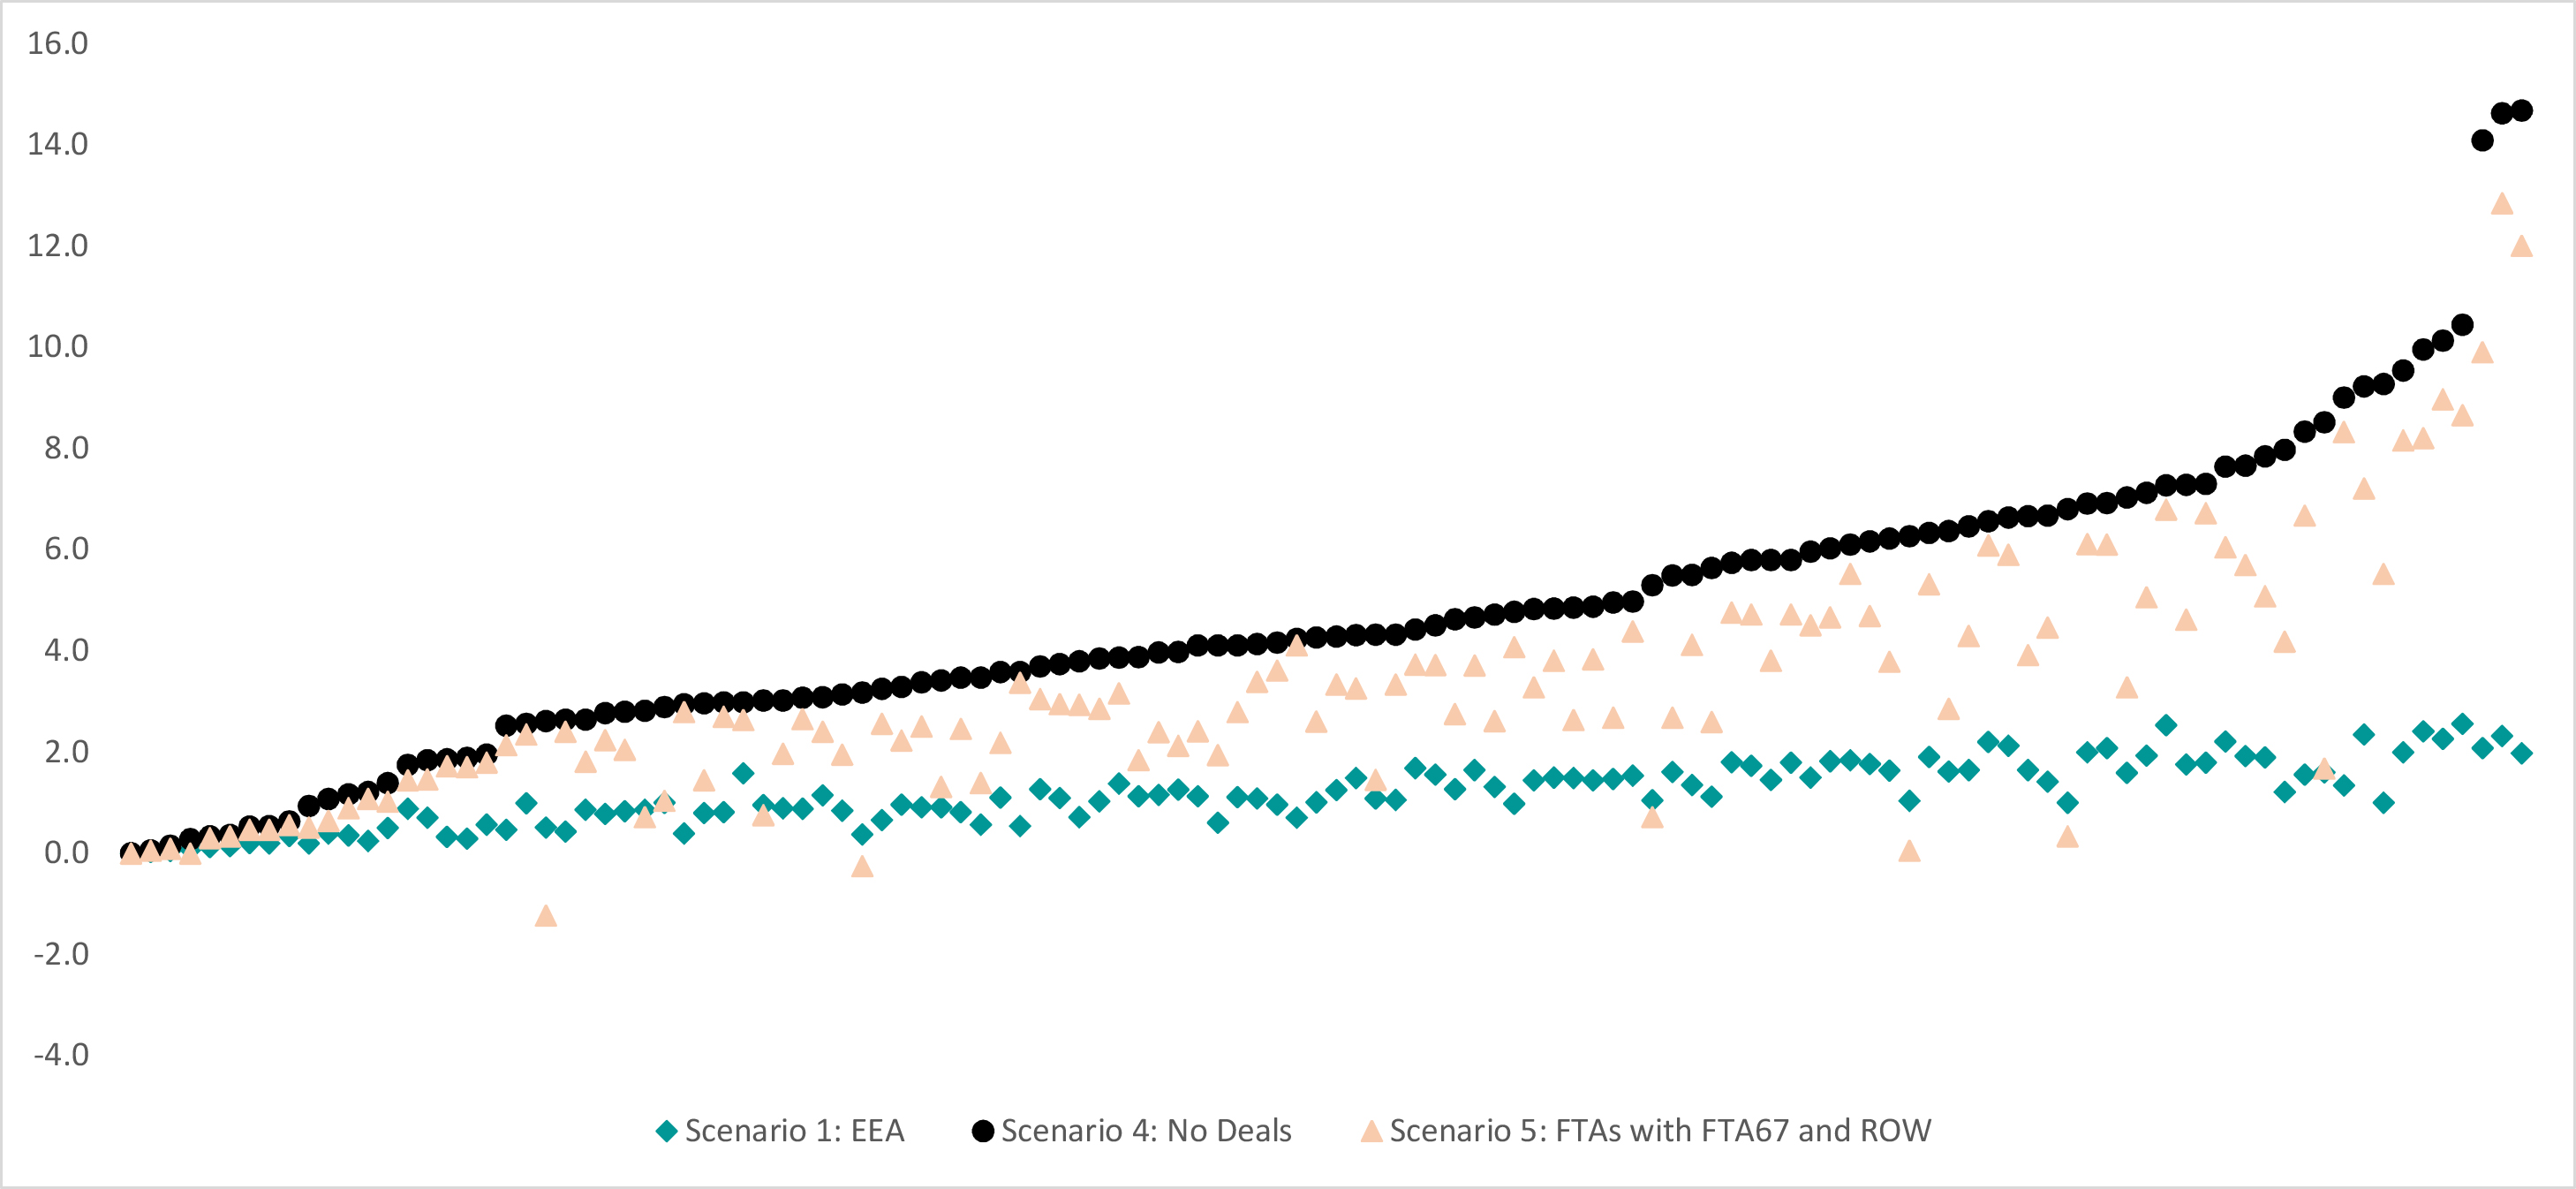
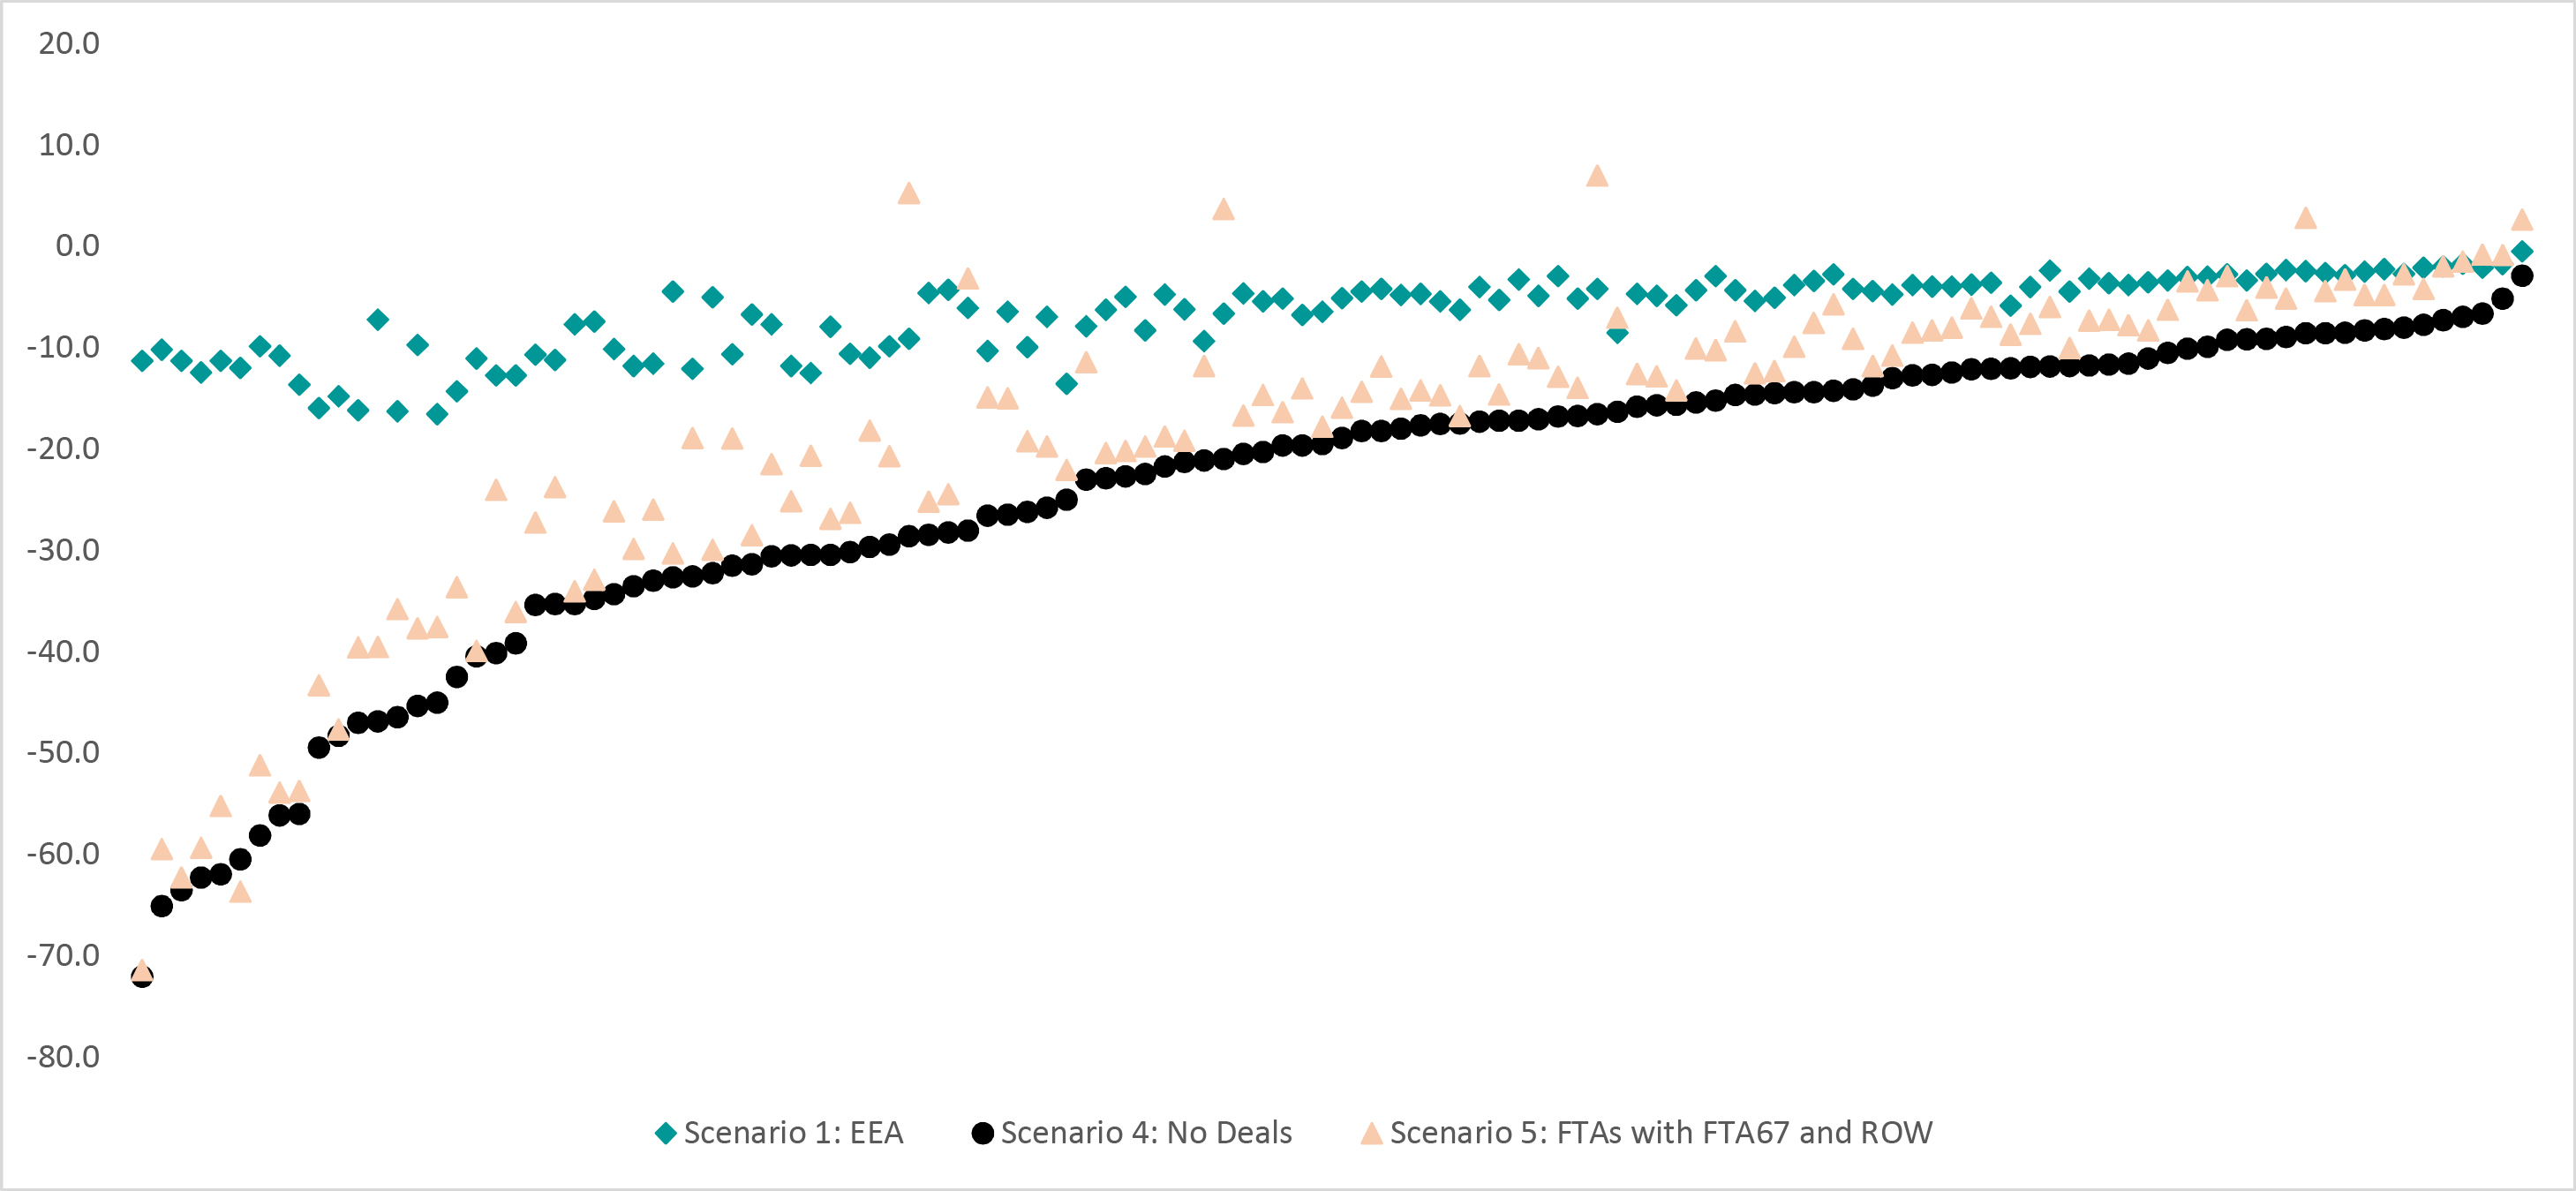
These average effects mask significant variation in how Brexit may affect different manufacturing sectors. To examine these differences, we look at the distribution of price, exports, imports and output (percentage) changes in three Brexit scenarios: the softest ‘EEA’ (Scenario 1), ‘no deals’ (Scenario 4) and ‘FTA with FTA67 and ROW’ (Scenario 5).[10]
Consider first Figure 3. The series labelled ‘no deals’ gives the changes in prices for each of our 122 sectors for the most pessimistic of our scenarios, where each dot represents a different industry. It can be readily seen that there is considerable variation across sectors in the impact of Scenario 4 (‘no deals’) on prices, with increases ranging from close to zero to 15%. Under this (‘no deals’) scenario, the median sector is set to experience an increase in prices equal to 4.3%, and for five sectors prices rise by more than 10%. The distribution and magnitude of changes across sectors is a bit different for the other two scenarios, though in the main the pattern of results is fairly similar.
Figure 3: Brexit scenarios: percentage change in prices across different manufacturing sectors
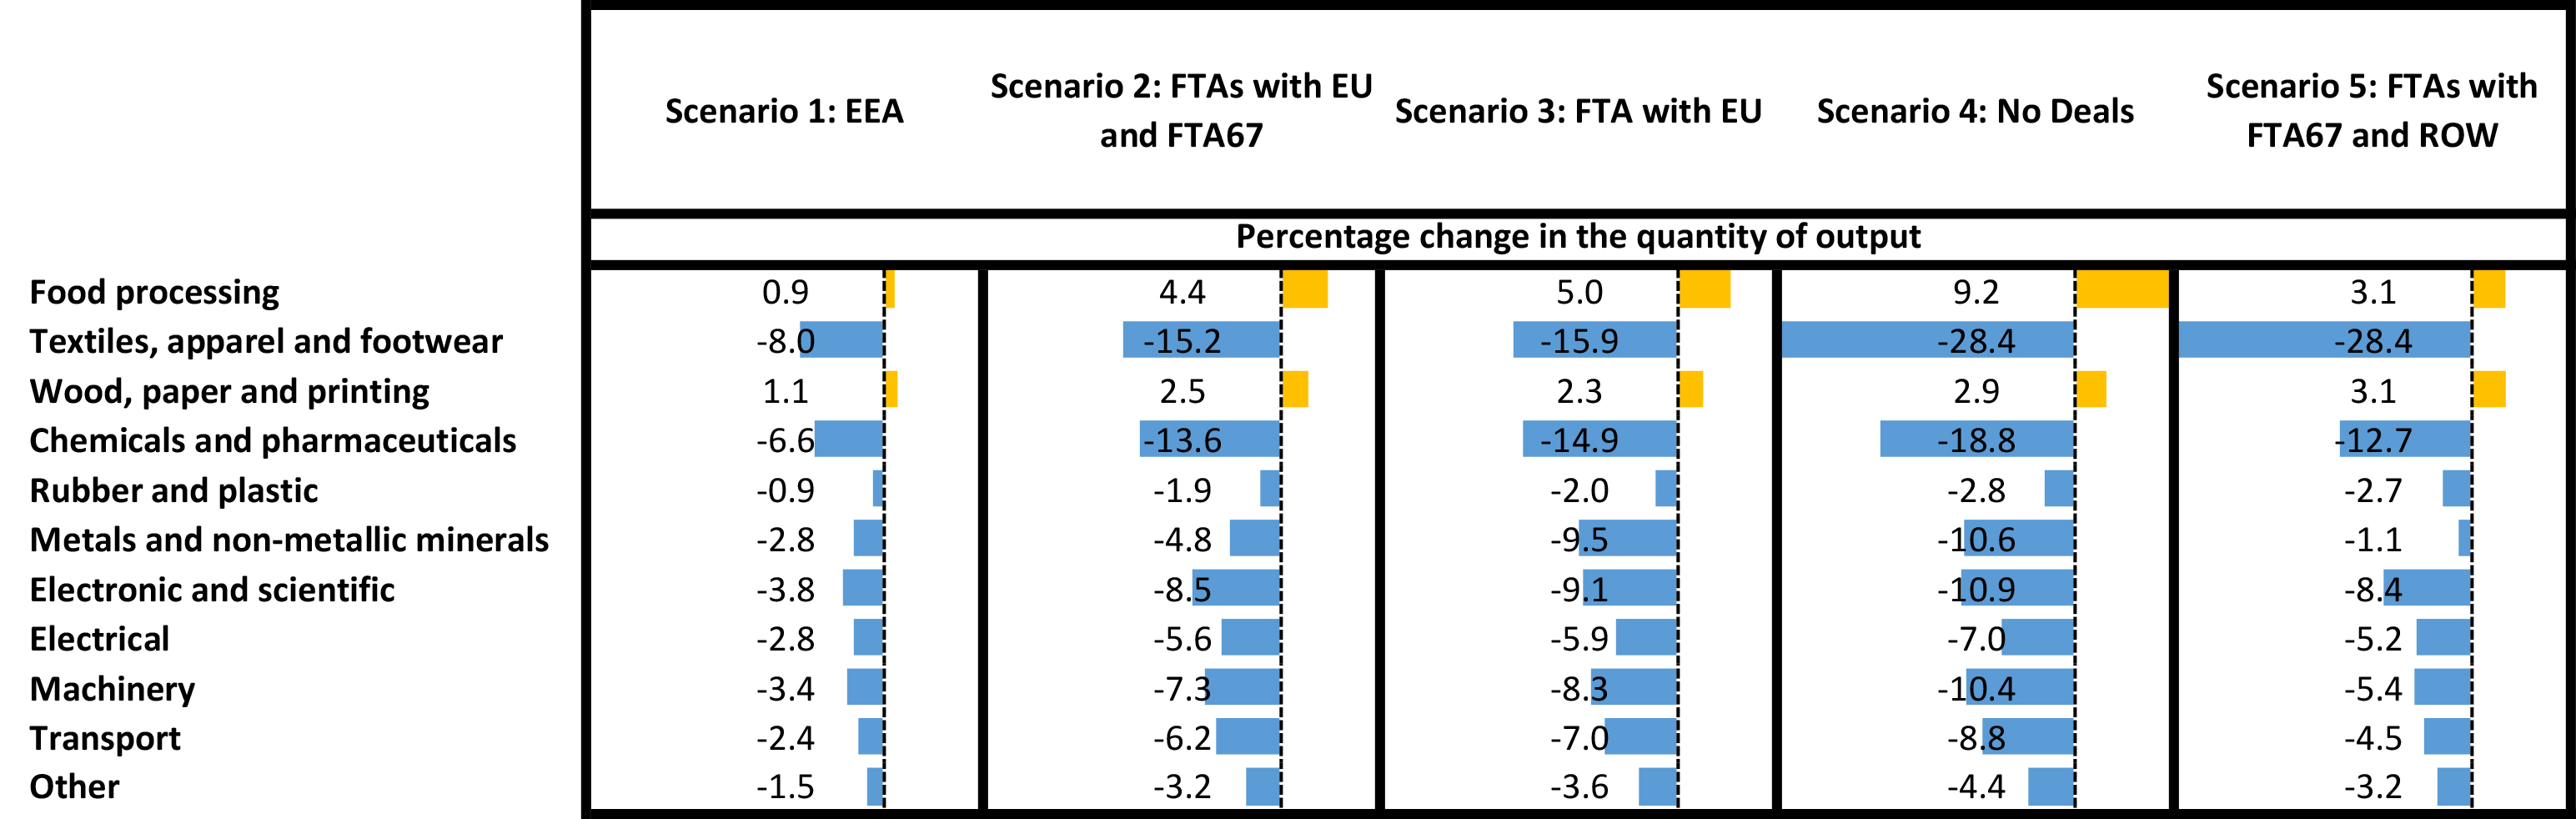
We also display the results for all 5 scenarios in Figure 4 aggregated into 11 broad groups (which are somewhat broader than 2-digit divisions of the ISIC) listed.[11]The disaggregated and grouped results for exports, imports, and output are reported in Figures 5-10.
Figure 4 shows that consistently across the five scenarios the biggest increase in prices is for Transport, and for Chemicals and Pharmaceuticals. In the ‘no deals’ scenario prices increase by 9.8% for the Transport group, and 7.5% for Chemicals and Pharmaceuticals. The smallest impact on prices is for Wood, Paper and Printing (1.0% in the ‘no deals’ scenario).
Figure 4 shows the heterogeneity of the results across these broad groups. It is important to emphasise that there is also heterogeneity within groups. For example, within the Transport grouping prices rise by less than 1% for the Building of Ships, but by over 14% for Motor Vehicles.
Figure 4. Sectoral groups and Brexit: impact on prices
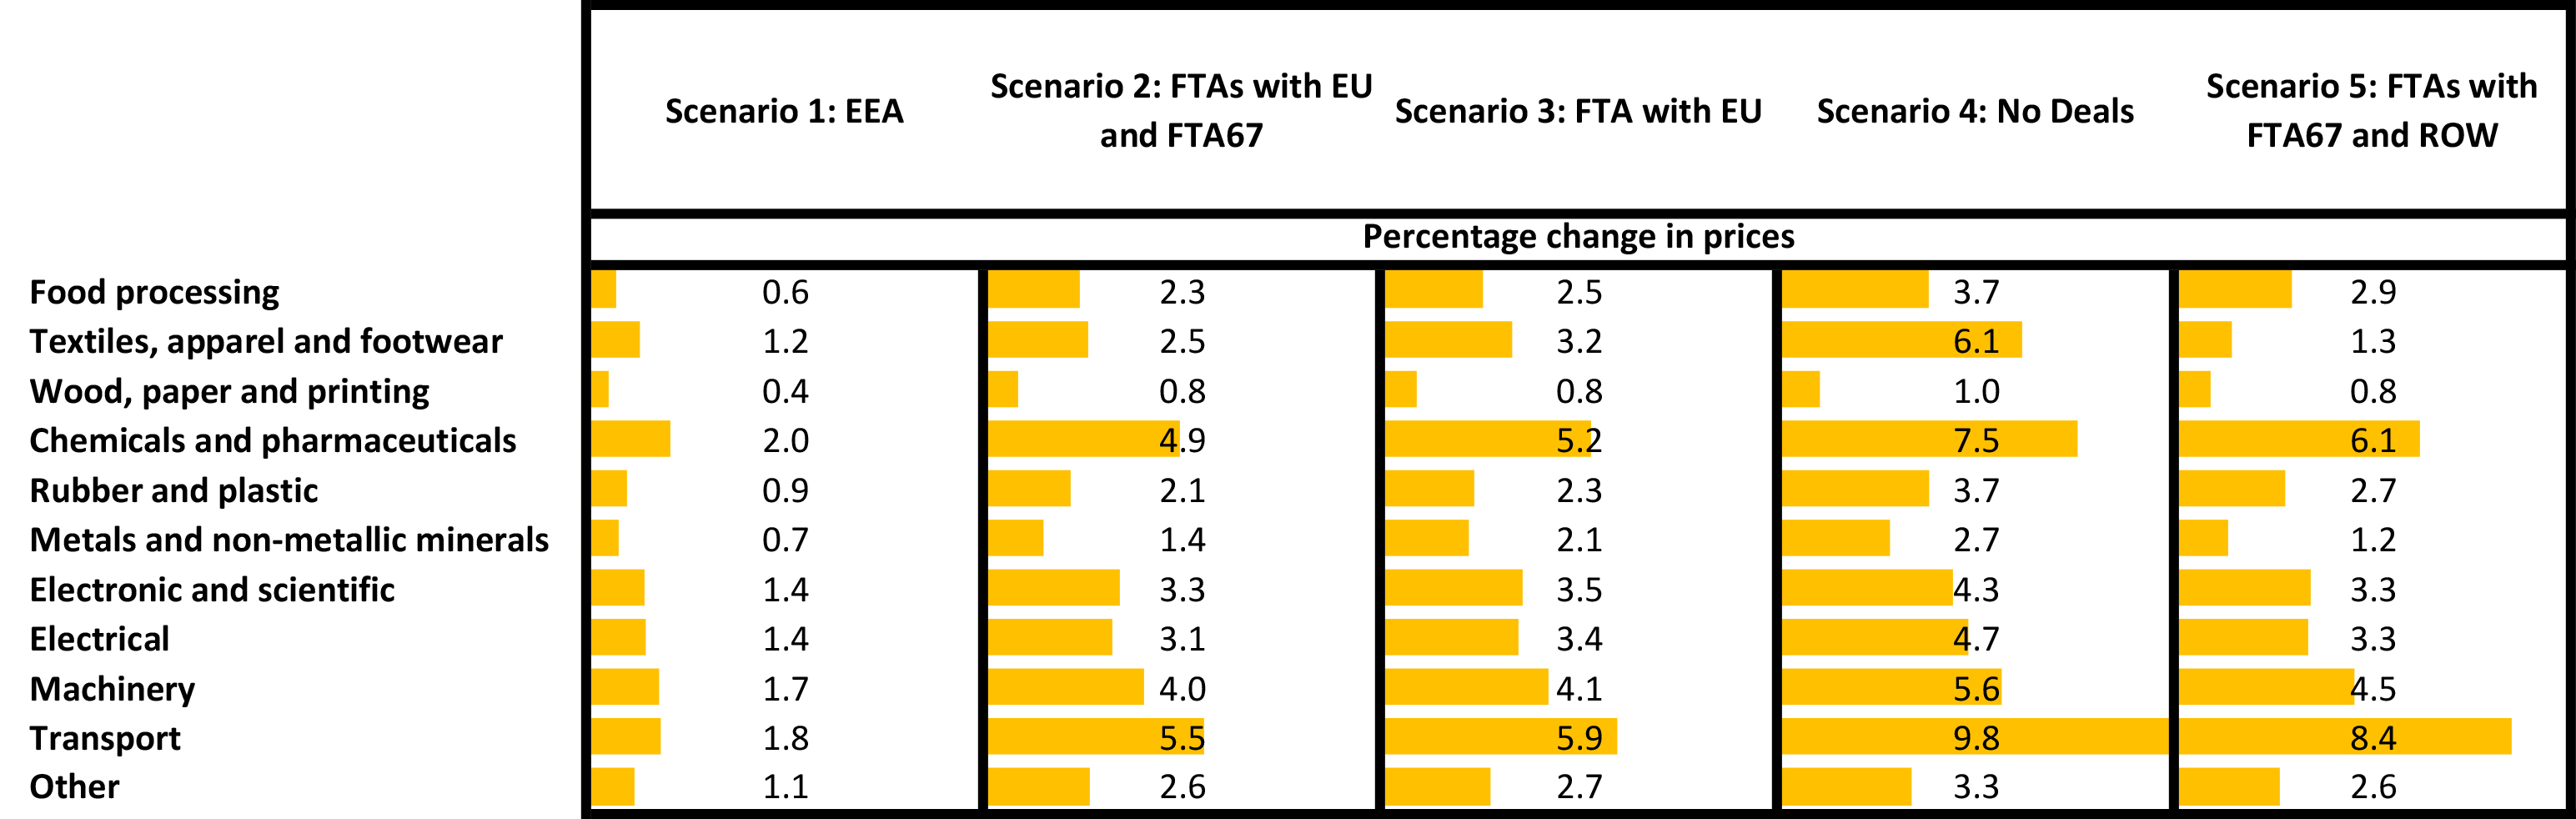
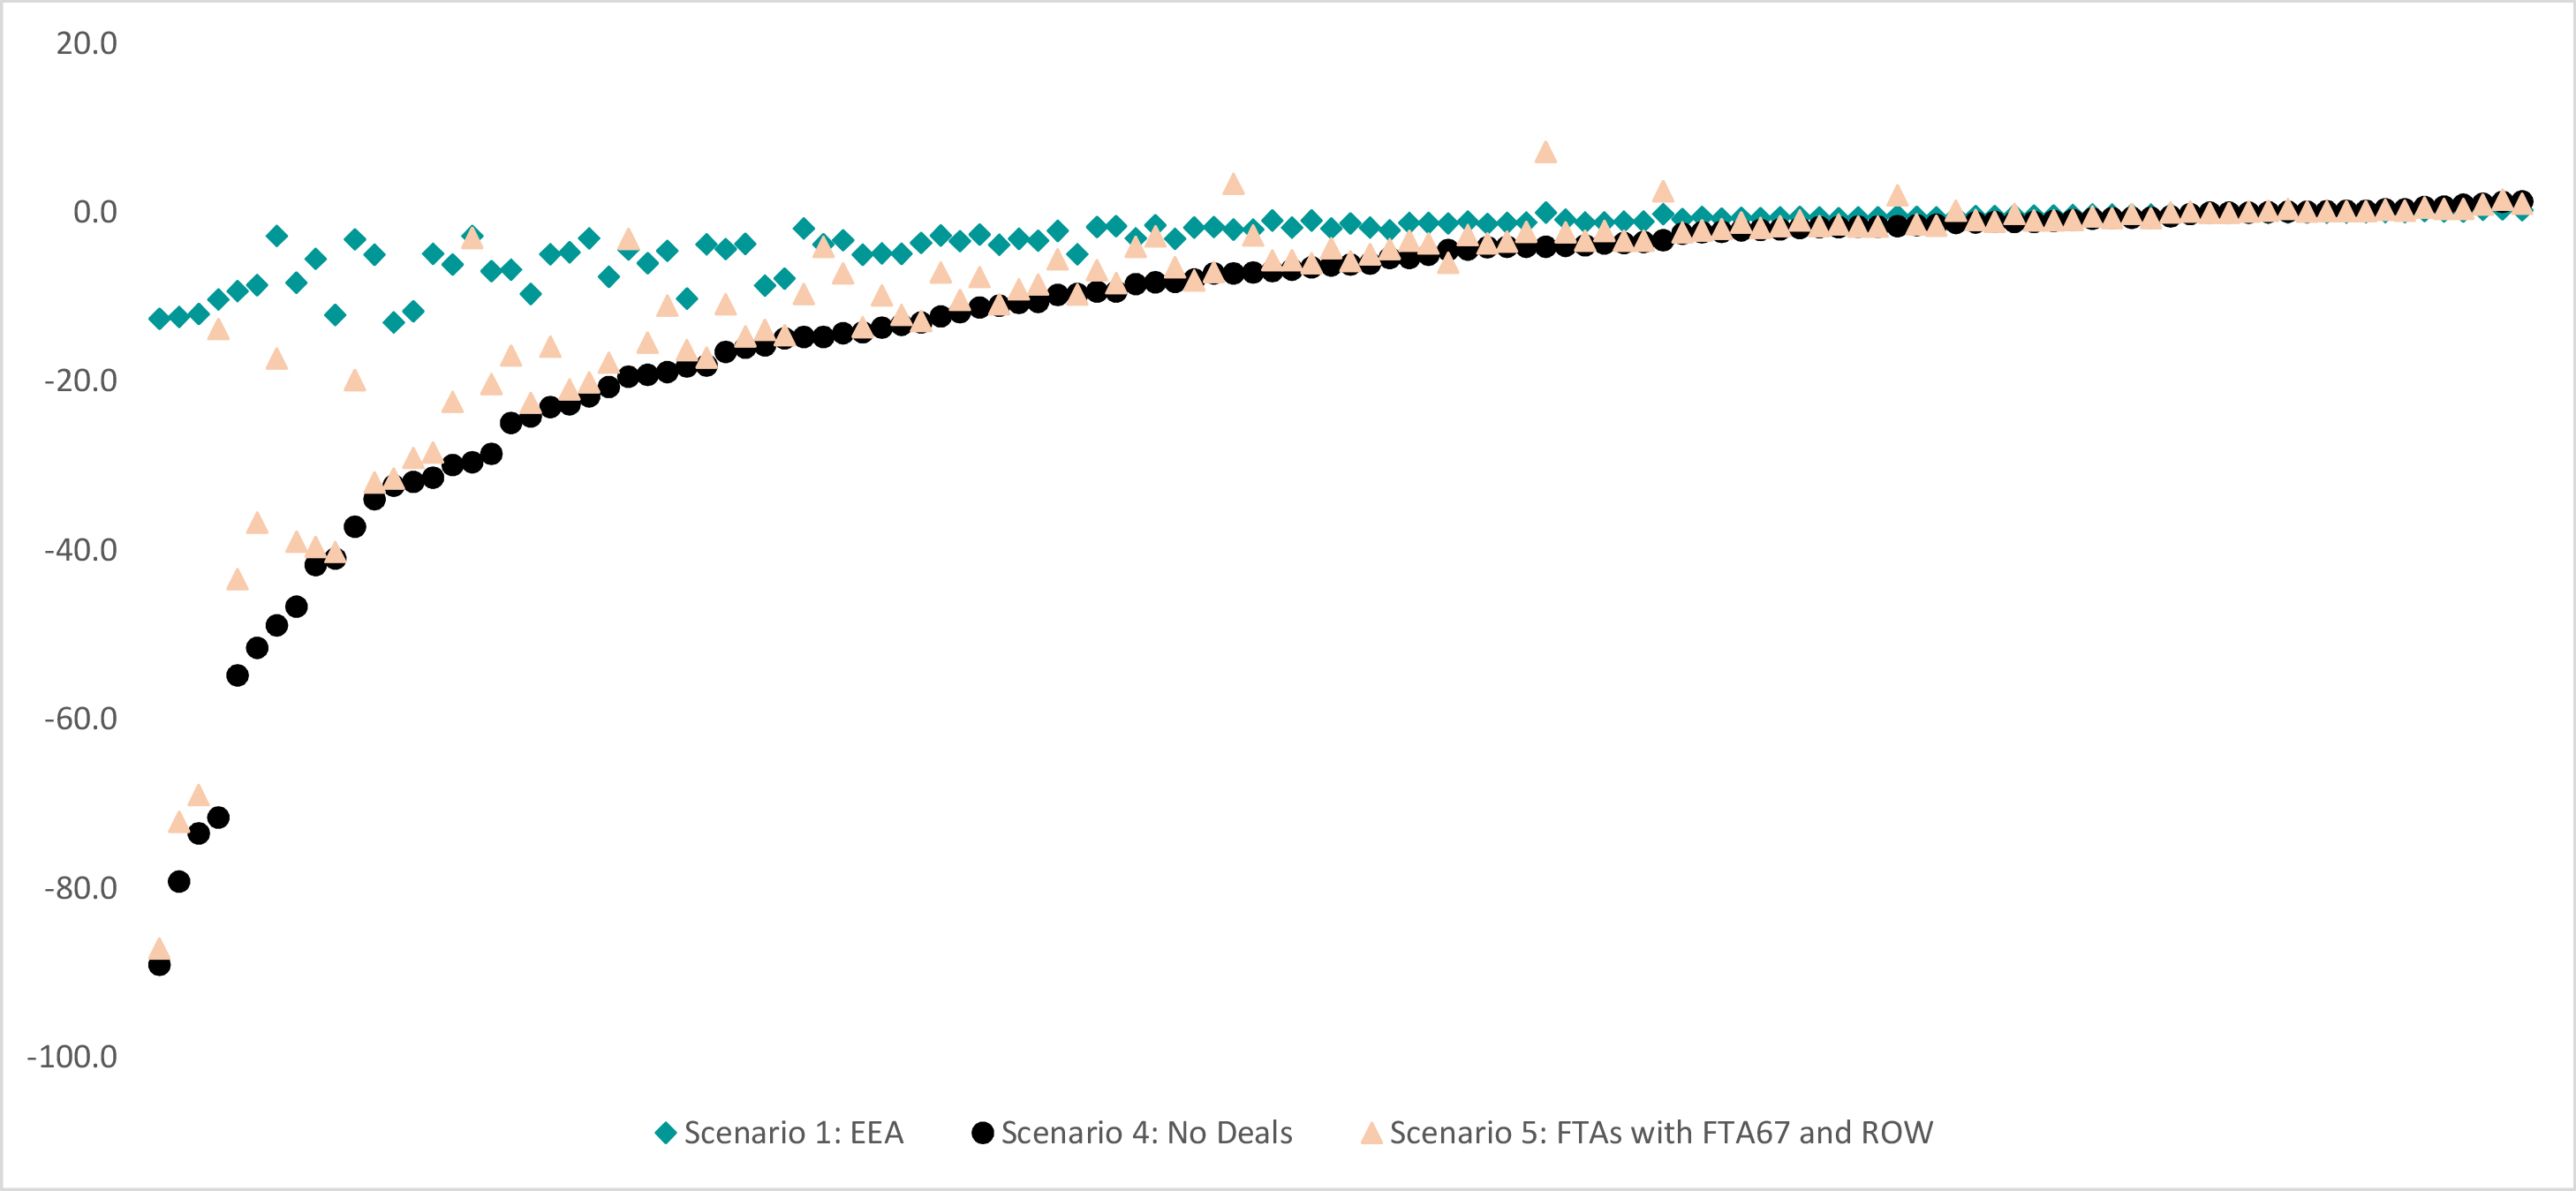
Figure 5 shows that Scenario 4 leads to export declines for all sectors. Trading on WTO terms (with no other trade agreements in place) could translate into a decline in exports value as large as 72% (and a 19% decline for the median sector). But in Scenario 5 (‘FTAs with FTA67 and ROW’) there is an increase in the value of exports for a small number of manufacturing sectors.[12]
Figure 5. Brexit scenarios: percentage change in exports across different manufacturing sectors
The sectoral grouping in Figure 6 suggests that the Food Processing industry is most at risk of a significant fall in exports after Brexit: all the sectors that are projected to have a decline in exports in excess of 50% in the ‘no deals’ scenario belong to the Food Processing industry. This concentration reflects the fact that this is the industry with the highest trade barriers and that, as a result, UK trade is heavily focused on the EU. Looking across the other scenarios, the larger the size of the policy change the larger the magnitude of these effects: exports of the Food Processing group decline by 6.9% in the ‘EEA’ scenario, but by 38.4% in the ‘no deals’ scenario. Textiles, Apparel and Footwear also appear likely to experience relatively large declines in exports after Brexit.
Figure 6. Sectoral groups and Brexit: impact on exports
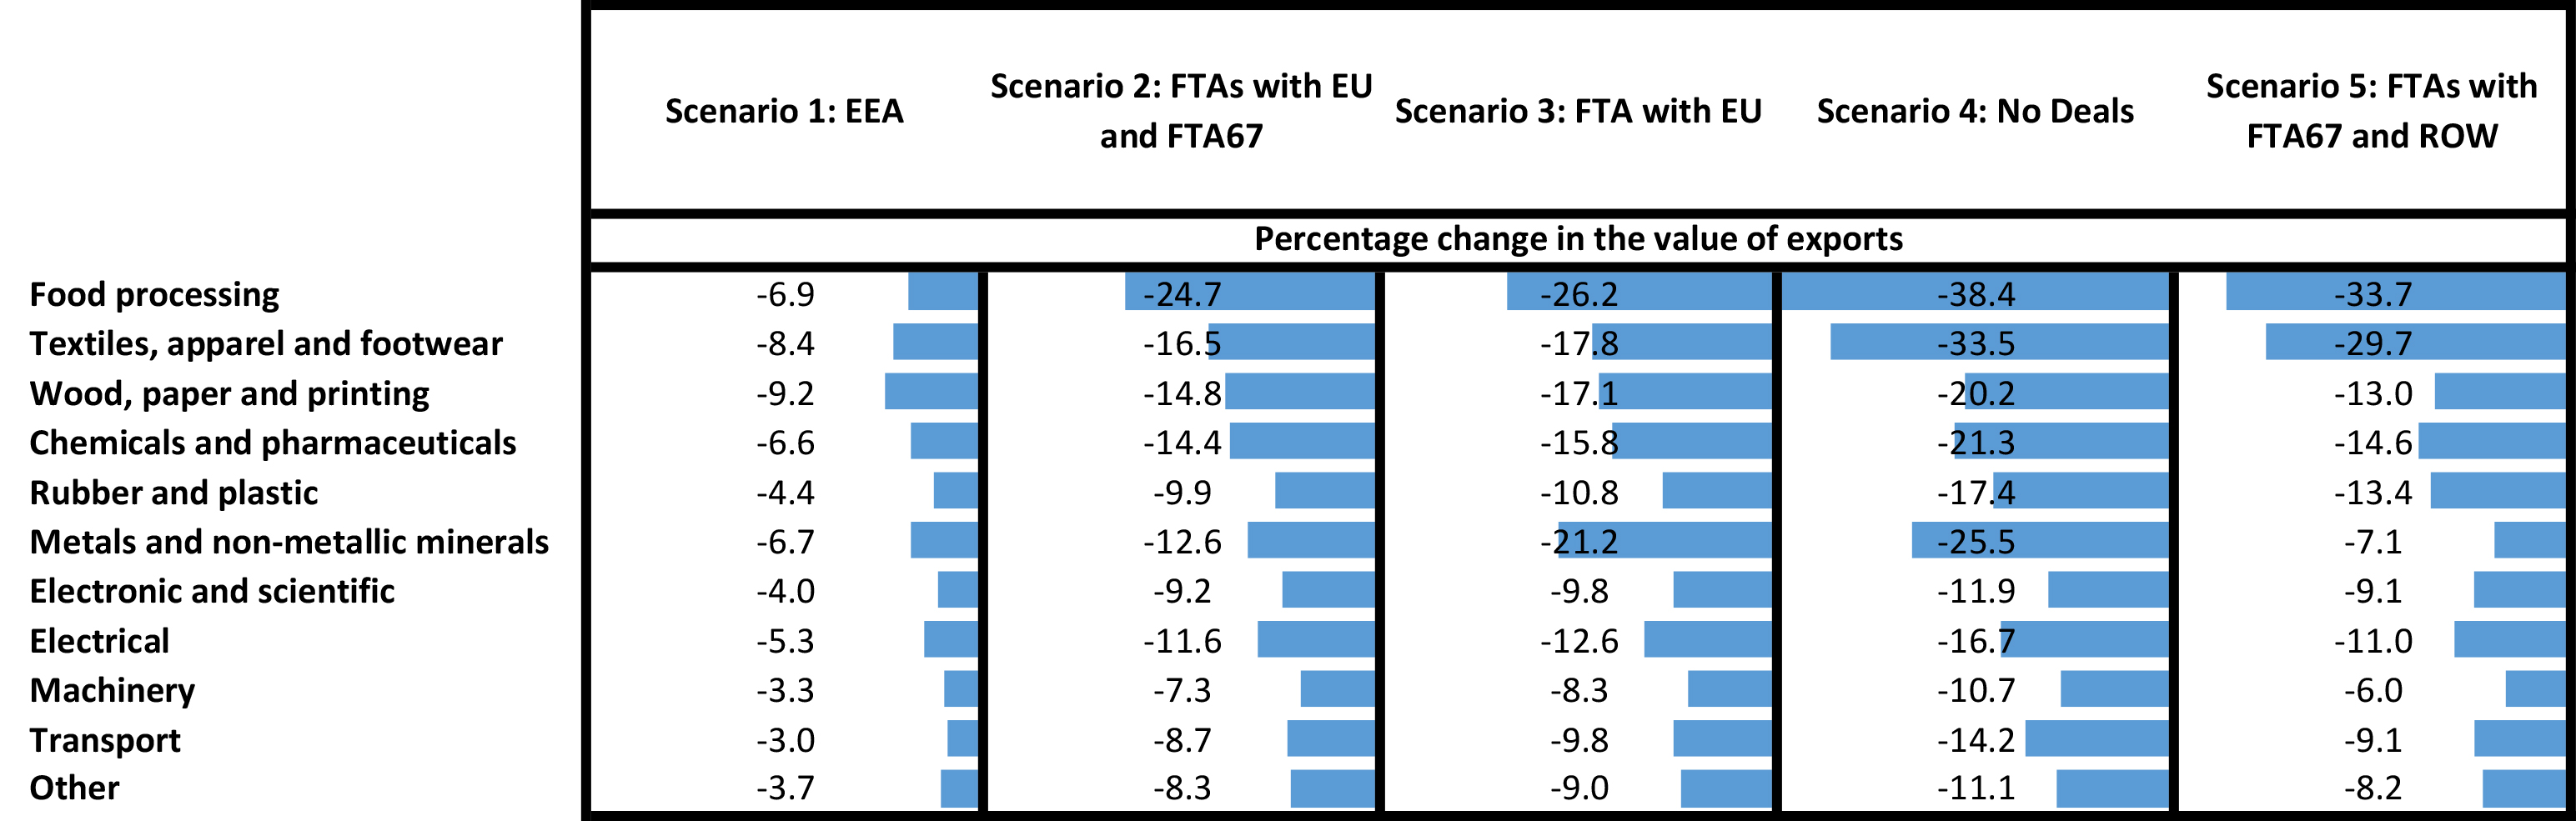
Figure 7 shows that manufacturing imports also fall as a result of Brexit, with some sectors (such as dairy products) experiencing a decline in import value of almost 90% in Scenarios 4 and 5. The median sector has a 6% decline in imports in the ‘no deals’ scenario. There are 17 sectors for which the value of imports may be higher after Brexit, regardless of which scenario we assume. These rises in imports for the 17 sectors are projected to be relatively modest (often less than 2%), and the biggest increase of over 7% is for Knitted and crocheted fabrics in Scenario 5.
Figure 7. Brexit scenarios: percentage change in imports across different manufacturing sectors
As with exports, Figure 8 shows the biggest declines in imports to be in the Food Processing group: varying from 6.8% in the ‘EEA’ scenario to 46.3% in the ‘no deals’ scenario. Wood, Paper and Printing is the only other group in which the decline in imports reaches double-digits, with the effects on imports for all remaining sectoral groups expected to be modest. The larger declines in both exports and imports for the Food Processing group are driven in good part by the size of the tariff and non-tariff barriers in these sectors, coupled with the extent of trade with the EU.
Figure 8. Sectoral groups and Brexit: impact on imports

Finally, we turn to changes in output for individual sectors in Figure 9. Unlike prices (which are all projected to increase) and exports/imports (which are largely expected to fall), there is a more mixed picture for output. In all three of the Brexit scenarios displayed in Figure 9, output is expected to fall for some two-thirds of sectors but to increase for the rest. The median sector experiences a 2.0% reduction in output in Scenario 1, a 3.6% reduction in Scenario 5 and a 5.6% reduction in the ‘no deals’ Scenario 4.
The reason for this mixed picture is that output is affected by both exports and imports. Increasing tariffs and NTMs on UK imports ‘protects’ domestic industries and encourages output to increase. Protection is at the expense of consumers and intermediate goods purchasers who face higher prices. In some sectors, the consequent expansion of domestic production is greater than the negative impact arising from lower export sales. Figure 10 shows the differences in the grouped results.
Again there are differences within groups as well as between groups; while in Scenario 4 (‘no deals’) Food Processing output as an aggregate rises by 9.2%, the UK Macaroni sector is projected to enjoy an increase in output of over 90%: this is a sector where the share of the EU in both UK exports and UK imports is very high, the ad-valorem MFN tariffs are high, imports significantly exceed exports, and domestic production is low. By contrast, in the Distilling of Spirits output declines by more than 10% (exports are greater than imports, domestic production is high, and there is no change in tariffs).
Figure 9. Brexit scenarios: percentage change in output across different manufacturing sectors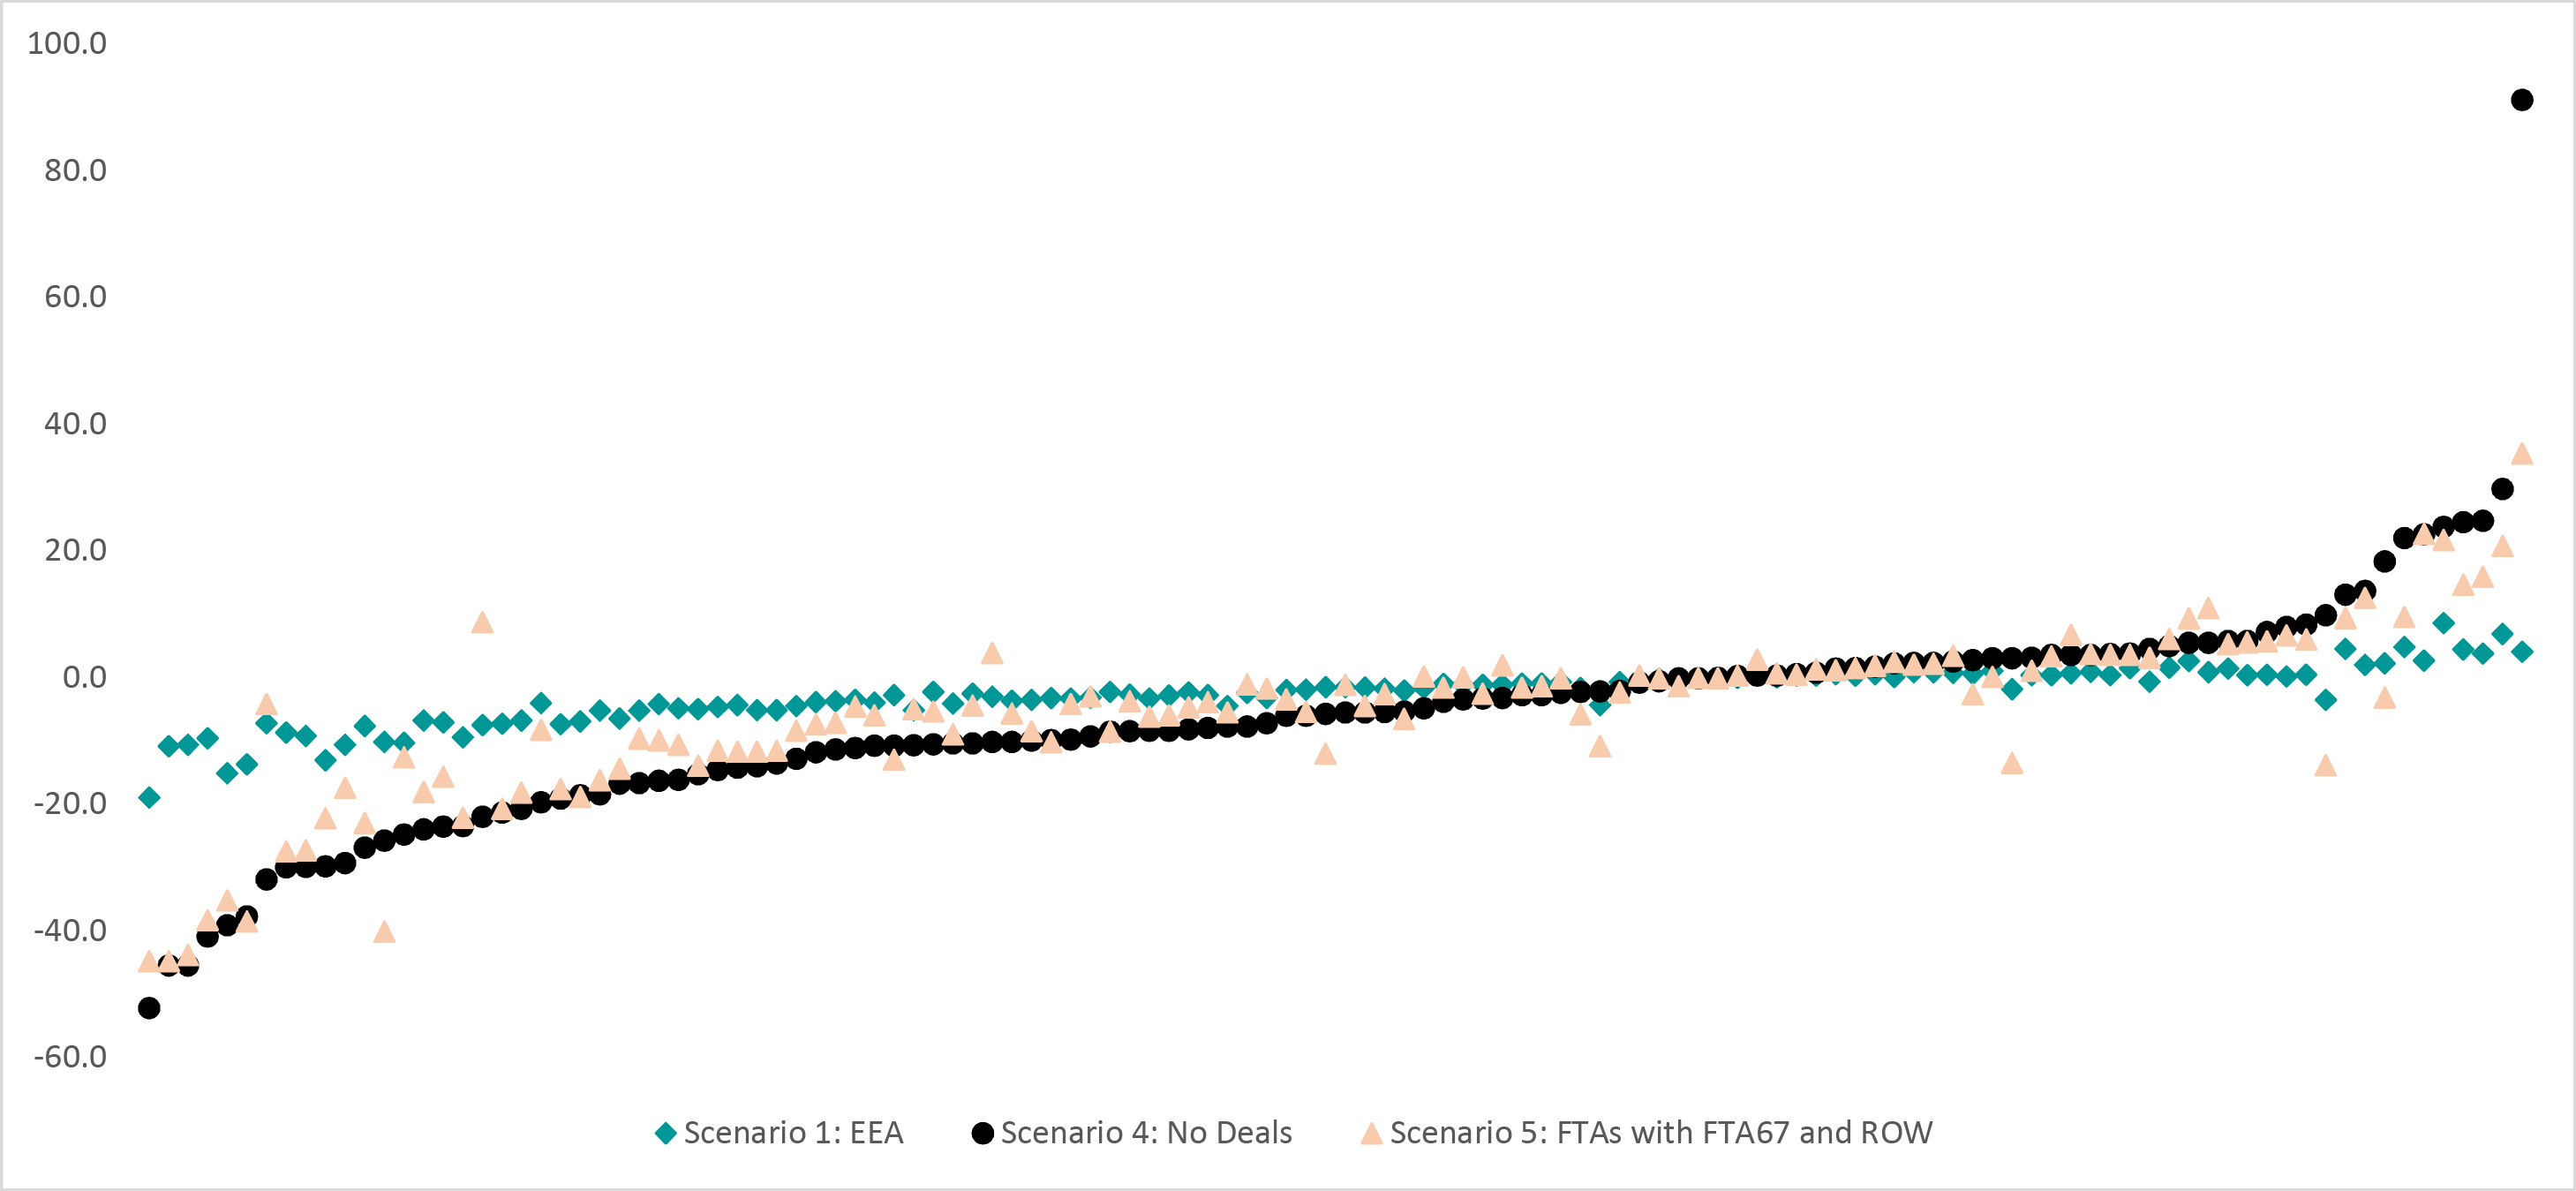
Figure 10. Sectoral groups and Brexit: impact on outputs
R&D-intensive sectors are often considered to be the drivers of economic growth, and the UK Government’s Industrial Strategy places an emphasis on building a knowledge and innovation-led economy through R&D investment.[13] Understanding how Brexit may affect high R&D sectors relative to low R&D sectors may help shed some light on the possible longer-term implications of Brexit, even though partial equilibrium models look only at the immediate effects of policy shocks.
Using the OECD taxonomy,[14] we aggregated the 122 manufacturing sectors into four groups depending on the R&D intensity of their main production activities (high, medium- high, medium and medium-low R&D intensity).[15]
Among our 122 sectors, 10 are classed as high R&D: these are mostly in the Electronic and Scientific group (such as Consumer electronics), but also include Pharmaceutical and medicinal chemicals and Air and spacecraft and related machinery. With 40 sectors, medium-high R&D category is the second largest, including activities such as Electrical (Fibre optic cables), Machinery (Engines and turbines) and Transport (Motor vehicles). The medium R&D group has 22 sectors, including activities from the Metals and Non-Metallic Minerals, and Rubber and Plastics groups (as well as Other group, such as Jewellery and related articles). Finally, the medium-low category is the largest with 50 manufacturing sectors, mostly related to Food Processing industry but also Textiles, Apparel and Footwear, and Wood, Paper and Printing.
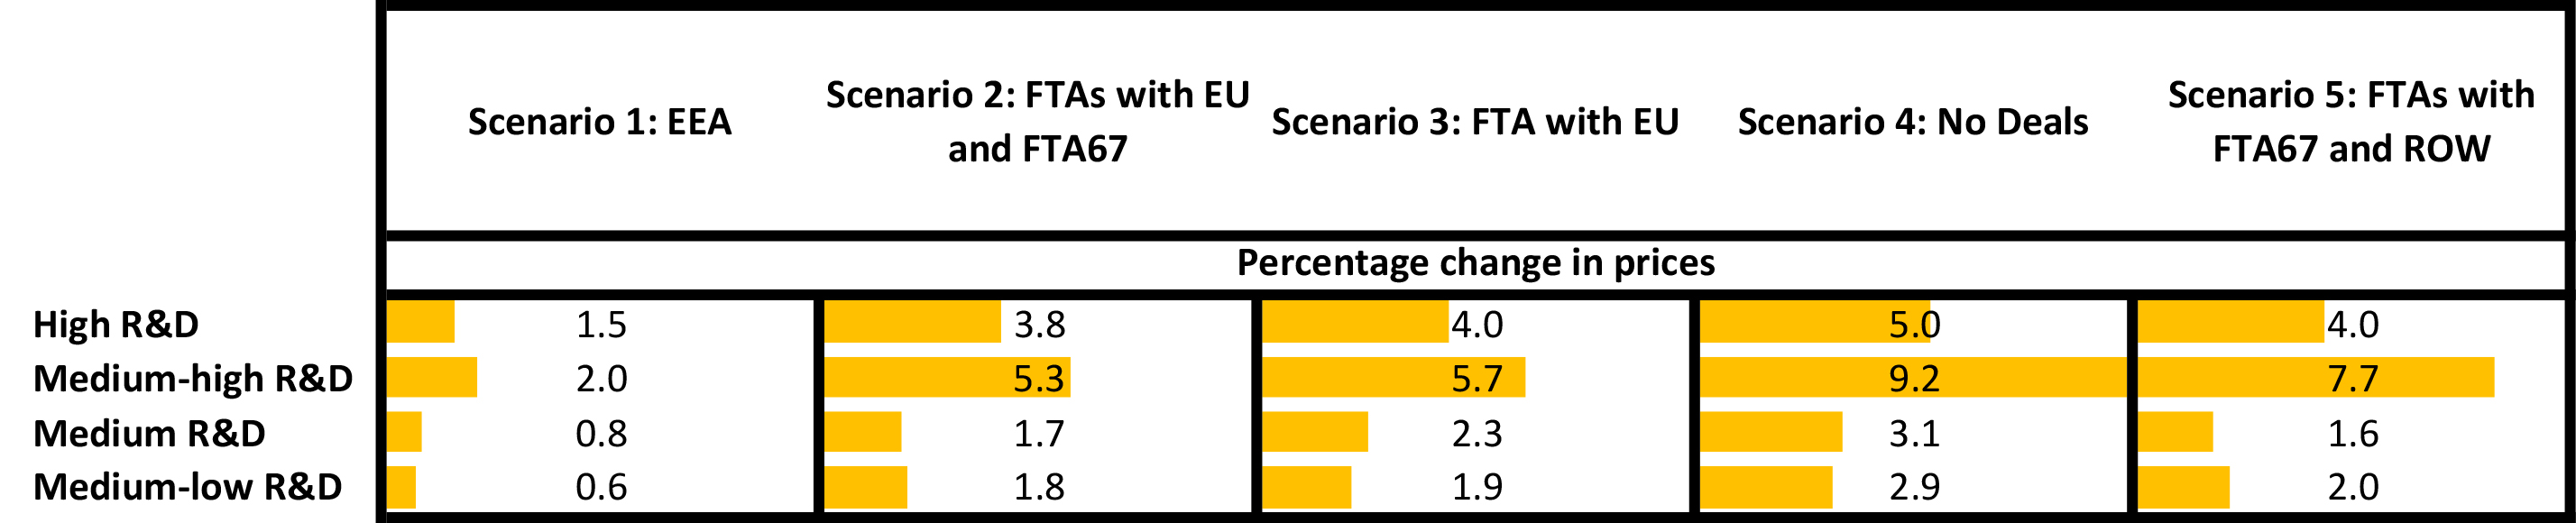
Figure 11 shows that across all five Brexit scenarios, Medium-high R&D intensive manufacturing sectors will see the largest price rises, from 2.0% in the ‘EEA’ scenario to 9.2% in the ‘no deals’ scenario. The lowest price increases are in the ‘Medium’ and ‘Medium-low’ sectors.
Figure 11. R&D intensity and Brexit: impact on prices
Figures 12 and 13 show that it is the ‘Medium-low’ sectors which may face the largest reductions in trade, both exports and imports, with export declines of more than 20% and import declines of up to 20% (except in the ‘EEA’ scenario). On the import side, the most striking features are the large declines in the ‘Medium-low’ sectors and the small effects in the ‘High’ sectors.
Figure 12. R&D intensity and Brexit: impact on exports

Figure 13. R&D intensity and Brexit: impact on imports
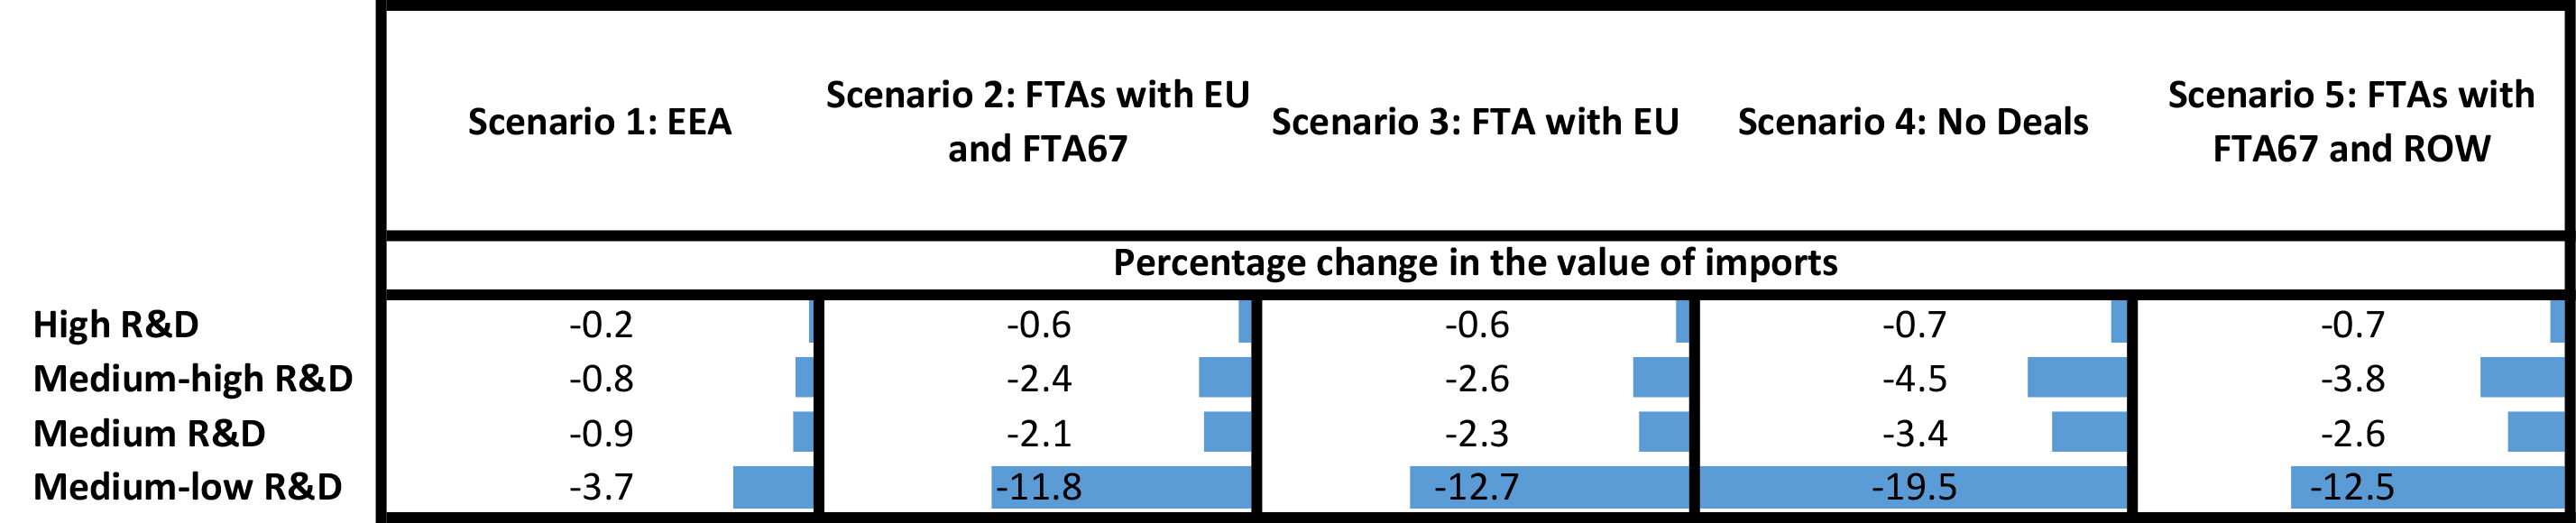
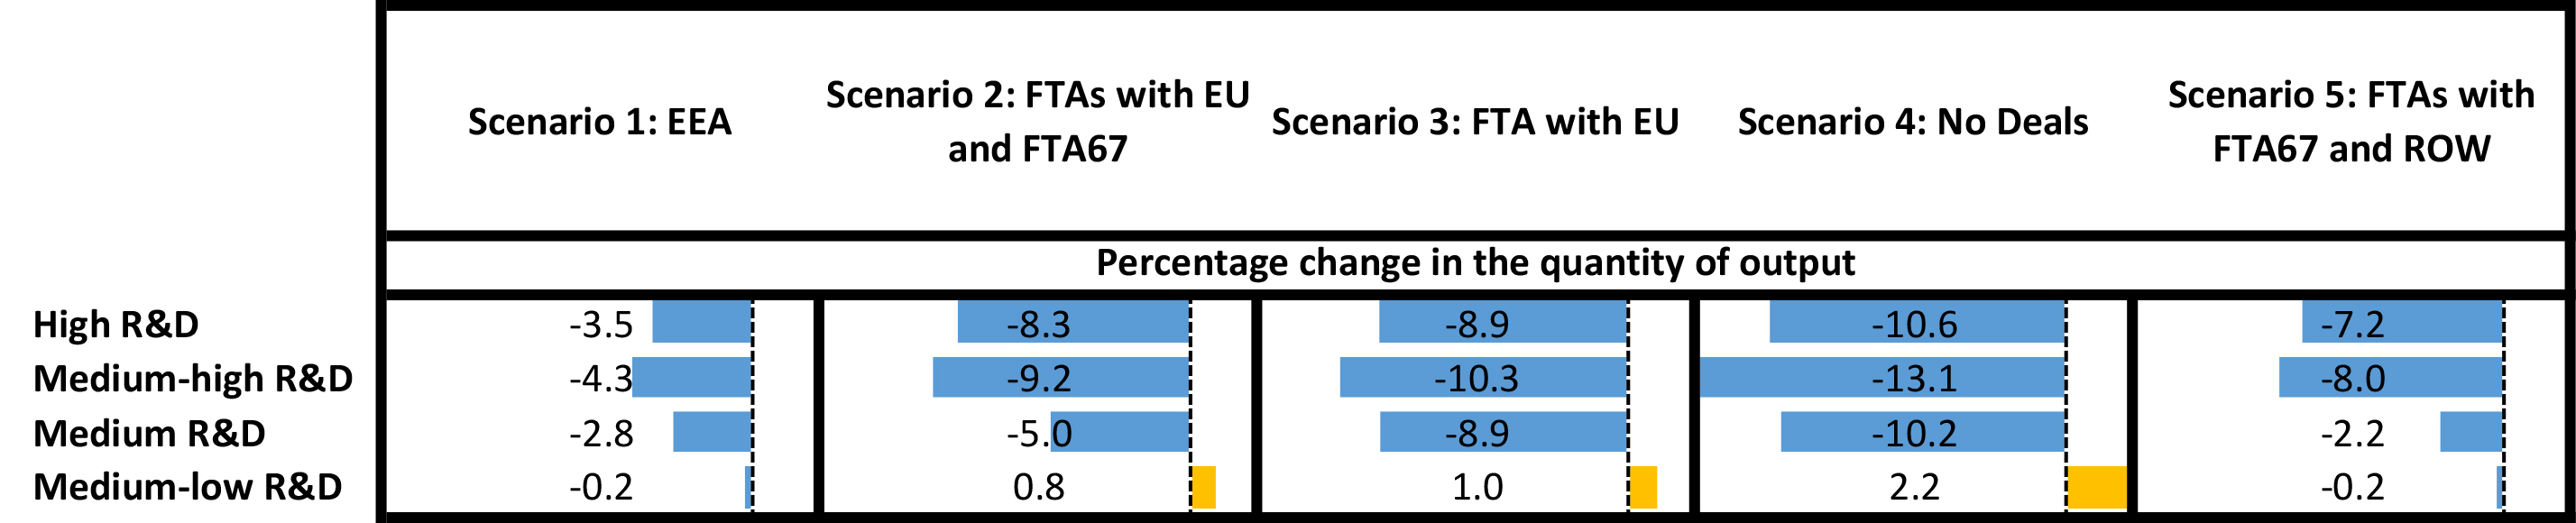
Figure 14 displays the output changes. Medium-low R&D manufacturing sectors stand out, in that for three scenarios they are predicted to see a positive growth in output and only modest declines for the remaining two Brexit scenarios. The other three aggregates show output declining in all scenarios.
This has implications for the UK government’s ambition to support economic growth and drive productivity through R&D and innovation.
Figure 14. R&D intensity and Brexit: impact on output
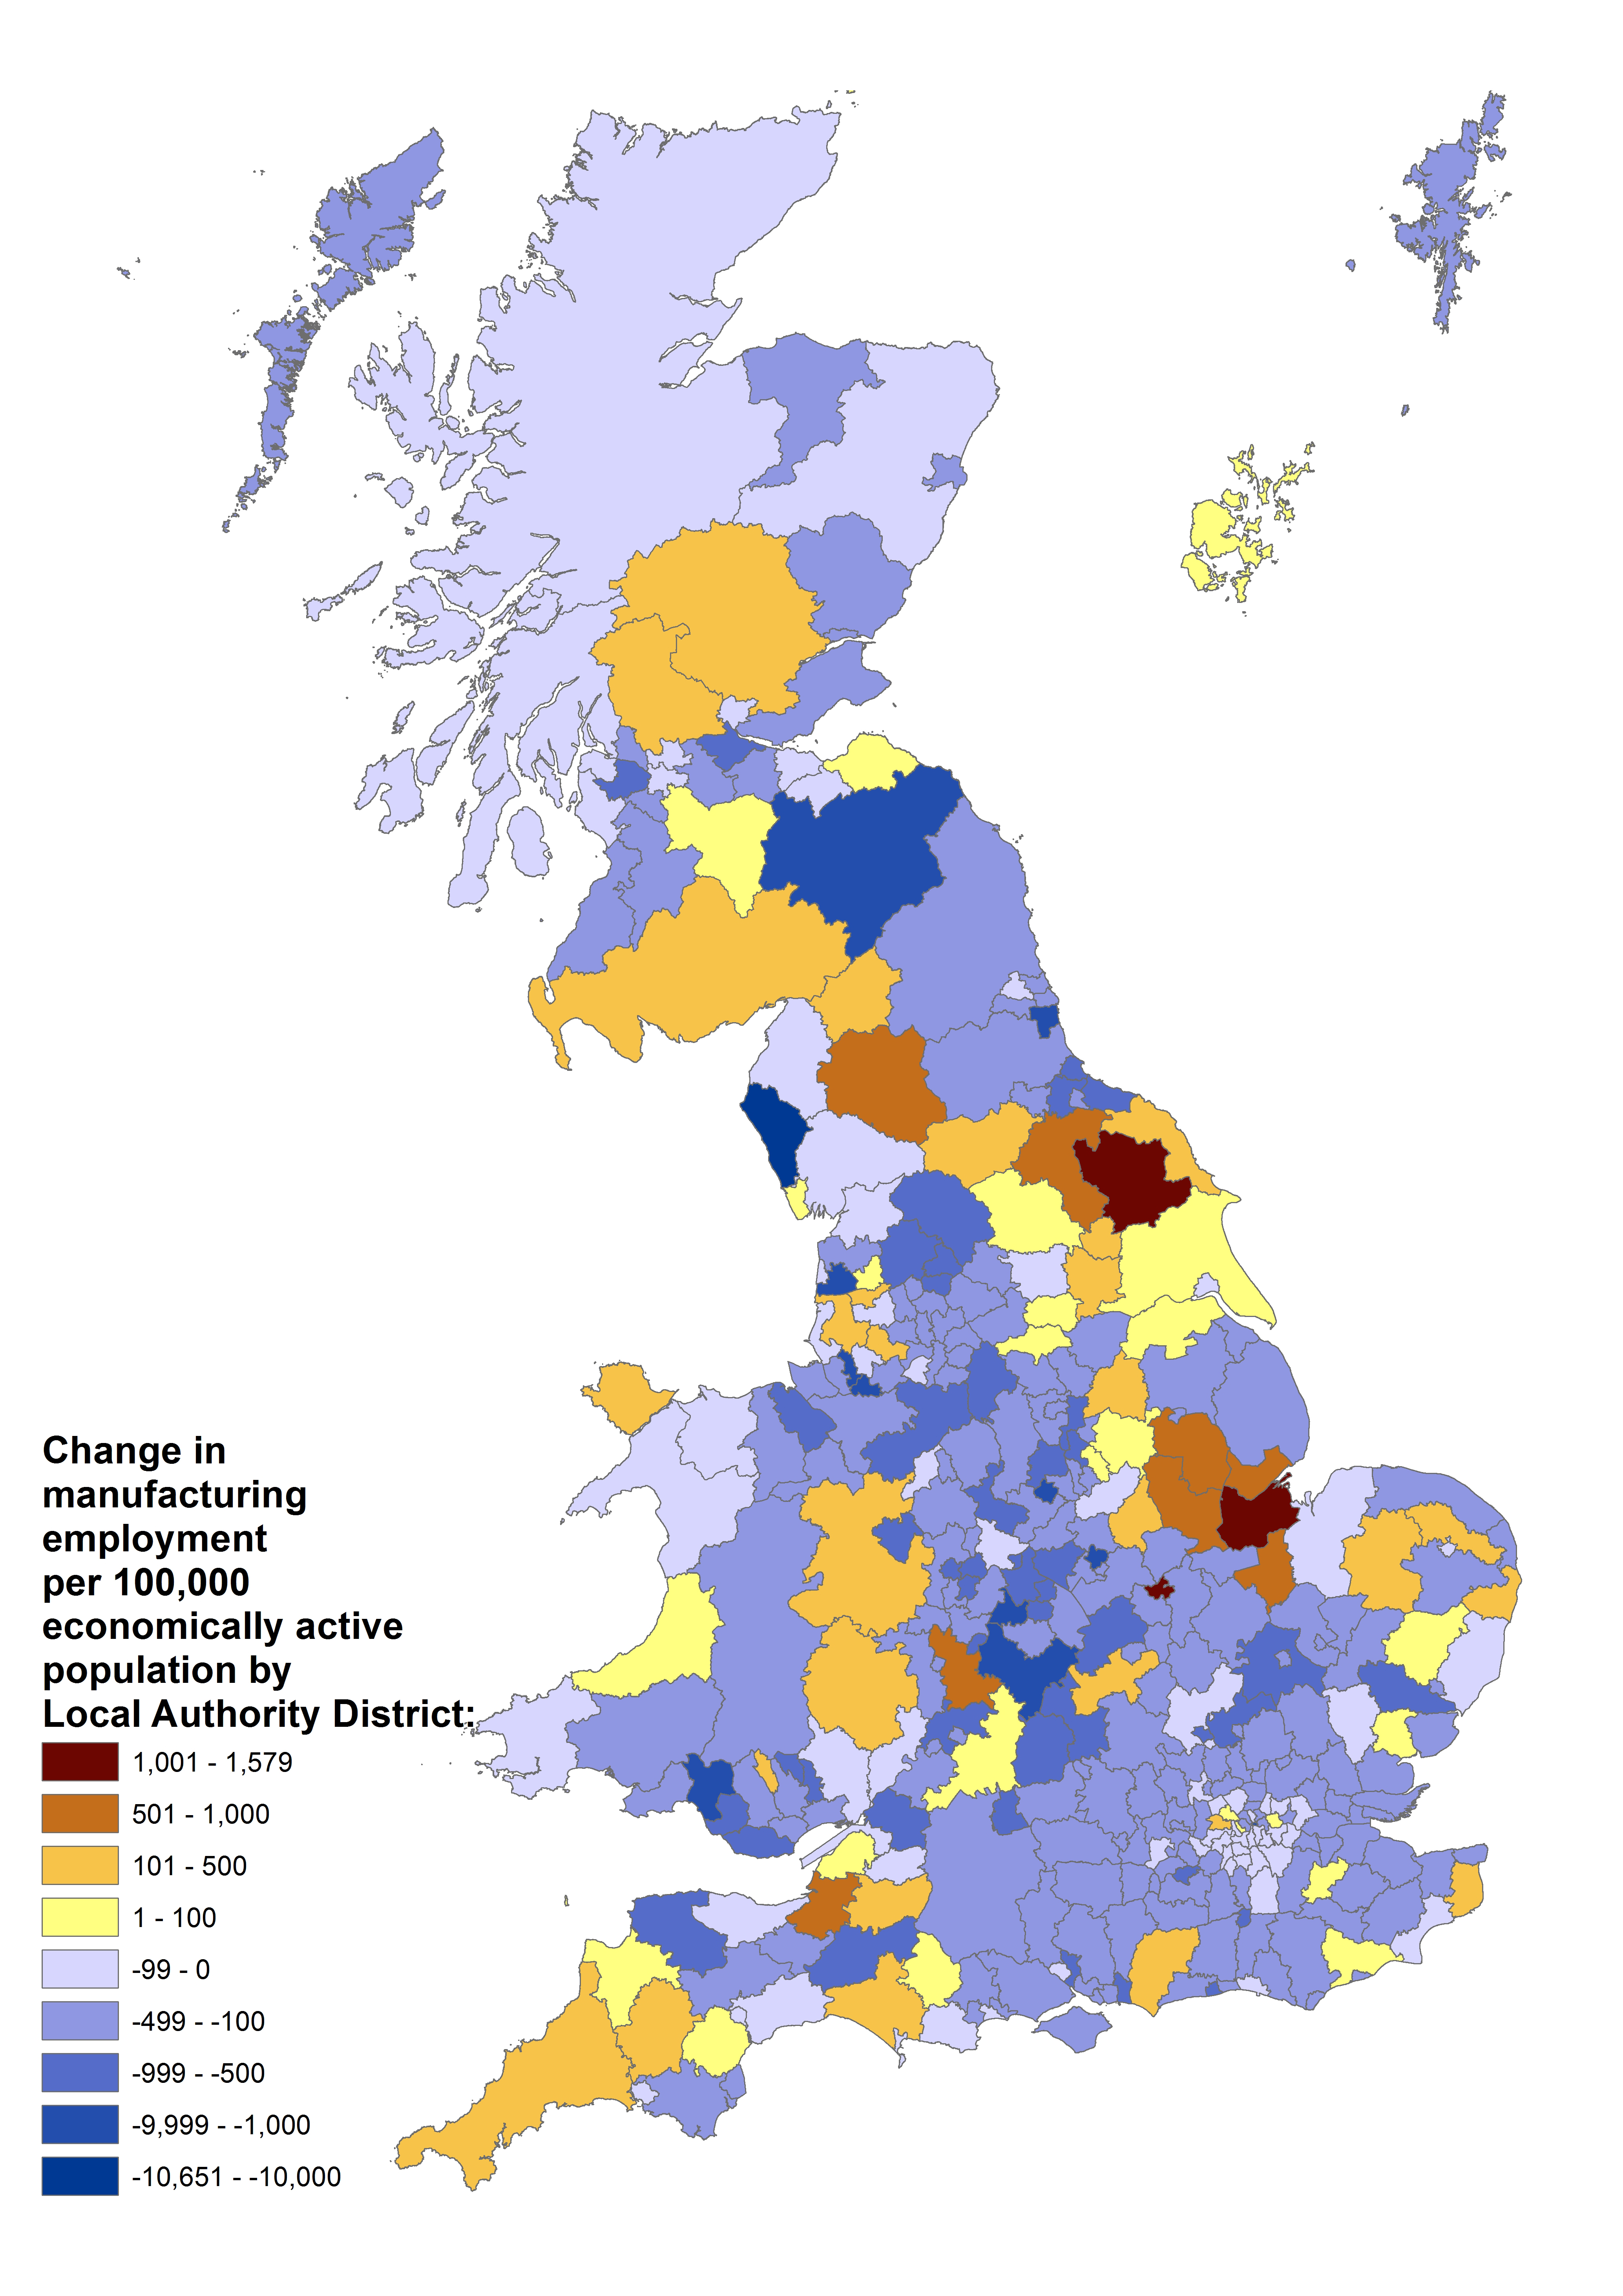
Assuming that employment effects are proportional to output changes (i.e. a 5% reduction in output results in a 5% reduction in employment), and using information about the regional distribution of different manufacturing sectors, we can translate our projections of the output effects of different scenarios into the employment vulnerability for different parts of the country. The results for the ‘no deals’ scenario are shown in Figure 15. Here we map the vulnerability (possible impact), in proportion to the size of the economically active population in each area. We reiterate that our local employment effects of Brexit concern solely manufacturing employment, and do not reflect the full potential effect of Brexit on employment.
The majority of local authority districts are expected to experience a manufacturing employment loss from Brexit. Copeland is predicted to be the most negatively impacted area with more than 10,000 jobs lost for every 100,000 economically active residents. This arises partly because, as we noted above, Copeland’s small pool of workers is concentrated in manufacturing (nuclear fuel processing), and partly because in our data nuclear processing is aggregated with a number of other non-ferrous metal activities, some of which experience big Brexit-related shocks. Even at the level of detail at which we are working, sectoral averages do not capture all the sub-sectoral detail.
Other local authority districts most at risk of a substantial decline in manufacturing employment include Fylde (where employment is concentrated in the manufacturing of aircraft), Stratford-on-Avon (manufacturing of motor vehicles) and Leicester (manufacturing of wearing apparel). This reflects these areas’ high reliance for jobs on sectors that will suffer most from Brexit.
Figure 15. Impact of ‘no deals’ Brexit on manufacturing employment across Local Authority Districts
Source: Authors’ own analysis; Business Register and Employment Survey, 2016; Annual Population Survey, 2016; Ordnance Survey Boundary-Line.
South Holland, Corby and Ryedale, on the other hand, are the local authority districts that are most likely to gain employment in manufacturing from Brexit. Our modelling suggests that the ‘no deals’ version of Brexit could add more than 1,000 manufacturing jobs for every 100,000 economically active residents in these areas. These are areas in which food processing – a possible beneficiary from Brexit – is highly significant.
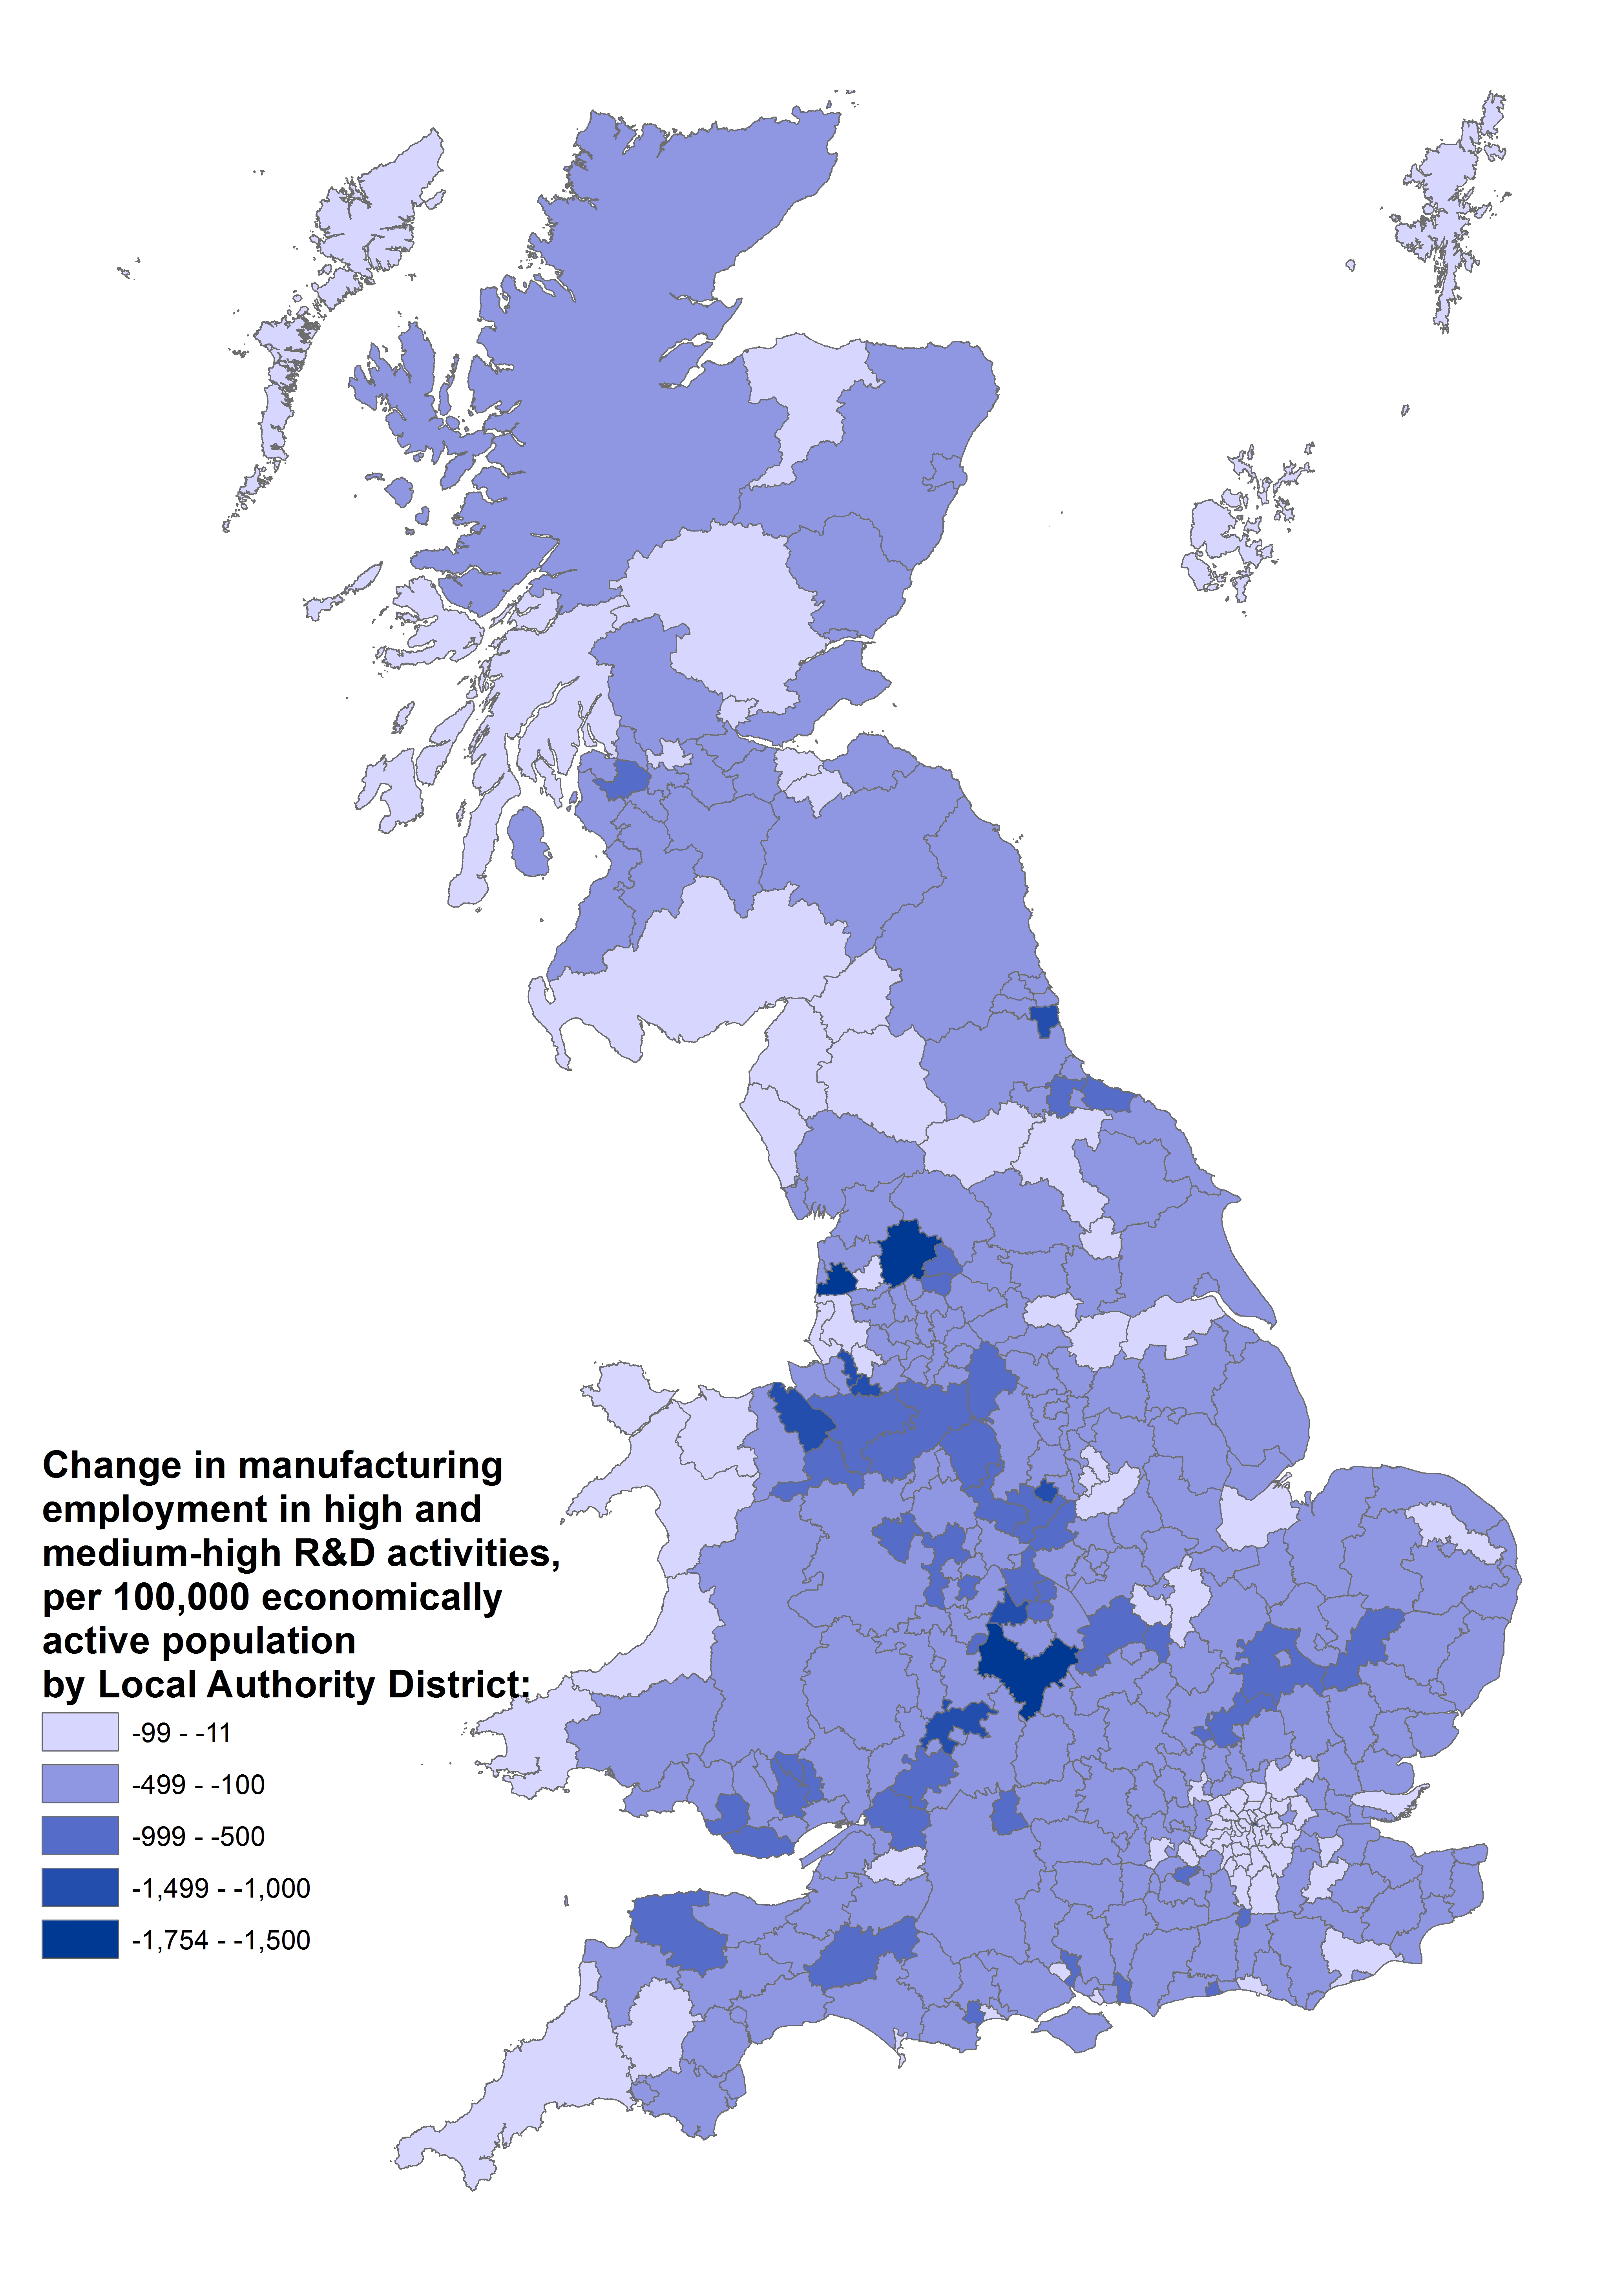
Knowing that high and medium-high R&D sectors are expected to be harder hit by Brexit than medium and medium- low R&D sectors, we also mapped the vulnerability of local authority districts to employment losses in these high-tech activities, as shown in Figure 16. Effectively, here we remove the possible employment effects from the lower-tech sectors.
Areas most at risk to substantial employment losses in high tech sectors include Stratford-on-Avon, Fylde and Ribble Valley, where for every 100,000 economically active residents more than 1,500 high tech jobs may be lost. As mentioned above, Stratford-on-Avon is an area where a high proportion of the employment is in the motor vehicle industry. Fylde and Ribble Valley, on the other hand, are specialised (as well as highly reliant) on the manufacture of air and spacecraft for jobs. Our simulation results for ‘no deals’ Brexit suggest that the motor vehicle sector may shrink by 10.4%, and air and spacecraft industry by 8.1%.
Figure 16. Impact of ‘no deals’ Brexit on manufacturing employment in high and medium-high R&D activities across Local Authority Districts
Source: Authors’ own analysis; Business Register and Employment Survey, 2016; Annual Population Survey, 2016; Ordnance Survey Boundary-Line.
Changes in absolute levels of employment offer further insights. With a possible employment loss in excess of 1,000, Sunderland, Birmingham, Coventry, Derby, Cheshire East, Solihull and County Durham are the local authority districts most vulnerable to the adverse effects of Brexit on high tech sectors. All of these areas have an established motor vehicle sector, with either a large-scale motor vehicle plant present in the local area or a number of businesses that supply this plant (as well as a sizeable pool of labour that relies on motor vehicle sector for employment). This provides further illustration of the significant risks that a ‘hard’ Brexit poses to large-scale manufacturing employers in the UK. Furthermore, the consequences will be more significant if we account for the wide-scale disruptive impact of Brexit on complex supply chains, something that goes beyond the scope of this briefing paper.
In this briefing paper, we have outlined some of the possible implications of the UK’s exit from the EU on 122 different manufacturing sectors. Using a partial equilibrium multi-market simulation model with an imperfectly competitive market structure, we have looked at how Brexit may impact on prices, the values of exports and imports, and the quantity of output produced for each of the manufacturing sectors.
None of the five Brexit scenarios that we model leads to a positive outcome for UK manufacturing on average: even EEA membership results in higher costs of trade between the UK and the EU, and with reduced market access in comparison to that currently enjoyed as a full member of the EU. These higher costs will harm UK manufacturing.
Our modelling suggests an average impact of Brexit on UK manufacturing industry similar to that in other Brexit impact studies. However, our study examines the potential vulnerability of different industries at a high level of disaggregation, using a consistent framework for all industries. The results show that there is a considerable heterogeneity in how different manufacturing sectors will be affected by Brexit and this, in turn, suggests considerable regional differences. These differences, coupled with the fact that most trade policy is made and applied at a very detailed level, highlight the importance of detailed disaggregated analysis for understanding the effects of Brexit on different sectors and different UK regions.
An important conclusion is that high tech and medium-high tech sectors are more at risk of a decline in domestic production than are medium and medium-low tech sectors. This has implications for Industrial Strategy that aims to support economic growth and drive productivity through R&D and innovation. There are some sectors (especially in the food processing industry) that may see an expansion in output after Brexit, but the effects are small and come at the expense of higher consumer and intermediate goods prices.
Lastly, we have looked at whether signing new trade deals can compensate for the loss of market access and trade with the EU. Our modelling of a scenario in which the UK leaves the EU without a deal but signs FTAs with all other countries in the world suggests that even these universal FTAs would not fully mitigate the loss of trade with the EU.
The two models used in the projections in this paper use variants of a two-stage Dixit-Stiglitz constant elasticity of substitution (CES) demand system for differentiated products. As is noted in the paper, the model is a partial equilibrium model in which each of the sectors is treated as independent of the others.
In the first model, we suppose that goods are differentiated only by country of origin and are sold in perfectly competitive markets. With four countries in our model there are four varieties of the product sold in each of the four national markets. Price is equal to marginal cost, and we assume that there are decreasing returns on a market-by-market basis: marginal cost in each market rises with sales in that market. The decreasing returns are at a mild rate: the assumed elasticity of supply is high. In each country market, the elasticity of demand for imports from each country source (and for the home-produced variety) derives from the assumed underlying elasticities and from market shares.
In this version of the model, products are differentiated by producing firm, so firms have some market power. Now the elasticity which enters a firm’s pricing decisions depends on the elasticities of demand for the product and for the product variety, and on the firm’s market share. Economies of scale arise from the spreading of fixed cost over a larger output. We also assume that firms’ marginal cost decreases with output, so there is a second source of scale economies. This second element gives rise to a multi-market linkage: if a firm expands its sales in one market, its marginal cost falls and therefore in all other markets its price falls and its sales expand.
In both cases, the model is numerically calibrated to fit the base dataset of outputs, trade flows and trade barriers. The calibration of the model requires estimates of elasticities of demand for different products and of substitution between product varieties, as well as estimates of the extent of market concentration and market power and of scale economies. However, our results are not very sensitive to such details – it is the data about trade barriers and trade patterns which are the prime determinants of our results rather than the fine detail of assumptions about economic behaviour.
Ottaviano, G.I.P., Pessoa, J.P., Sampson, T. and Van Reenen, J. (2014) The Costs and Benefits of Leaving the EU. CFS Working Paper No. 472.
Ciuriak, D., Xiao, J., Ciuriak, N., Dadkhah, A., Lysenko, D. and Narayanan, G.B. (2015) The Trade-Related Impact of a UK Exit from the EU Single Market. Open Europe Research Report.
HM Treasury (2016) HM Treasury Analysis: The Long-term Economic Impact of EU Membership and the Alternatives. HM Treasury, London.
Ebell. M. and Warren, J. (2016) The Long-Term Economic Impact of Leaving the EU. National Institute Economic Review, 236(1): 121–38.
Dhingra, S., Ottaviano, G., Sampson, T. and Van Reenen, J. (2016) The Consequences of Brexit for UK Trade and Living Standards. CEP BREXIT paper no. 02.
Ries, Ch.P., Hafner, M., Smith, T.D., Burwell, F.G., Egel, D., Han, E., Stepanek, M., and Shatz, H.J. (2017) After Brexit: Alternate Forms of Brexit and Their Implications for the United Kingdom, the European Union and the United States. RAND Corporation, Santa Monica.
Centre for Economic Policy Research (2013) Estimating the Economic Impact on the UK of a Transatlantic Trade and Investment Partnership (TTIP) Agreement between the European Union and the United States. Final Project Report, March 2013.
Francois, J., Manchin, M., Norberg, H., Pindyuk, O. And Tomberger, P. (2013) Reducing Transatlantic Barriers to Trade and Investment: An Economic Assessment. Final Project Report, March 2013.
Carrère, C. and de Melo, J. (2015) Are Different Rules of Origin Equally Costly? Estimates from NAFTA, World Scientific Book Chapters, in: Developing Countries in the World Economy, chapter 12, pages 277-298 World Scientific Publishing Co. Pte. Ltd.
Anson, J., Cadot, O., Estevadeordal, A., Melo, J. d., Suwa-Eisenmann, A. and Tumurchudur, B. (2005) Rules of Origin in North–South Preferential Trading Arrangements with an Application to NAFTA. Review of International Economics, 13(3): 501–17.
Cadot, O., Estevadeordal, A. and Suwa-Eisenmann, A. (2005) Rules of Origin as Export Subsidies. CEPR Discussion Paper No. 4999.
Hayakawa, K. (2011) Measuring Fixed Costs for Firms’ Use of a Free Trade Agreement: Threshold Regression Approach. IDE Discussion Papers No. 275, Institute of Developing Economies, Japan External Trade Organization(JETRO).
Cadot, O. and Gourdon, J. (2016) Non-Tariff Measures, Preferential Trade Agreements, and Prices: New Evidence. Review of World Economics, 152(2): 227-49.
This document was written by Michael Gasiorek, Ilona Serwicka and Alasdair Smith. The authors are grateful to Agnes Cimper from the OECD for sharing the OECD, Bilateral Trade in Goods by Industry and End-Use ISIC Rev.4 Conversion Key. The authors would like to thank Alan Winters for helping to initiate the research project and to Fellows of UK Trade Policy Observatory (UKTPO) for comments.
The authors asserts their moral right to be identified as the authors of this publication. Readers are encouraged to reproduce material from UKTPO for their own publications, as long as they are not being sold commercially. As copyright holder, UKTPO requests due acknowledgement. For online use, we ask readers to link to the original resource on the UKTPO website.
Read the online Appendix and Appendix 2 – Simulation Results
____________________________________________________________________________________
[1] Source: BEIS Business Population Estimates for the UK and Regions 2016.
[2] Source: ONS Blue Book 2017.
[3] Source: ONS Pink Book 2017. In 2016, the value of UK’s goods exports stood at £302 billion, increasing from £289 billion in 2015.
[4] The source of sectoral employment data is the ONS’s Business Register and Employment Survey (BRES). The source of data on economically active resident population across local authority districts is the ONS’s Annual Population Survey (APS). BRES data is also available for Northern Ireland but it captures employee jobs rather than employment, and data for lower level geographies such as district council areas are only available for SIC2007 industrial sections, such as C Manufacturing. For further detail, see: BRES Publications and Tables 2015, NISRA, at https://www.nisra.gov.uk/publications/bres-publications-and-tables-2015
[5] In reality, people often travel to work beyond the boundaries of their areas of residence. Therefore, a statement that 40% of Copeland’s economically active population is employed in manufacturing is an approximation but it illustrates the importance of this sector for the local economy.
[6] In comparison to the Armington model results, the simulation model with imperfect competition gives on average bigger impacts and greater variation across industries in response to a shock.
[7] In practice, membership of the Single Market lowers the costs associated with NTMs, but does not eliminate them. In our modelling of Brexit, however, we adopt a simplifying assumption that the Single Market keeps costs of NTMs at zero, while an EU-UK FTA is assumed to have low NTMs and trade in the absence of an FTA, conducted on WTO rules, has high NTMs. The estimates of low and high NTMs are based on what Cadot and Gourdon (2016) define as NTM level with and without an FTA respectively. See Cadot and Gourdon (2016) for further detail.
[8] It is possible that the average UK tariff on imports from the rest of the world is lower than that on imports from the FTA countries – something that is in part driven by the Generalised System of Preferences. In this situation, the simulation tariff is identical to the base tariff. Similar principle applies to choosing the ROW simulation tariff on imports from the UK.
[9] WITS, from where we collected data on tariffs, converts specific duties to ad-valorem equivalents using the UNCTAD conversion methodology. The calculation is outlined in: https://www.wto.org/english/res_e/publications_e/wto_unctad12_e.pdf
[10] For ease of presentation of these distribution charts, we are not displaying the in-between Scenarios 2 (‘FTA with EU and FTA67’) and 3 (‘FTA with EU’).
[11] Online Appendix provides full detail on how we allocated 122 manufacturing sectors into these 11 sectoral groups.
[12] Our results suggest that these sectors include Building of ships and floating structures (exports value up by 2.7%), Manufacture of machinery for metallurgy (2.9%), Manufacture of wiring devices (3.6%), Casting of iron and steel (5.3%) and Manufacture of cordage, rope, twine and netting (7.0%).
[13] See: Clark, G. (2017) Record boost to R&D and new transport fund to help build economy fit for the future. Avail- able at: https://www.gov.uk/government/news/record-boost-to-rd-and-new-transport-fund-to-help-build-economy-fit-for-the-future
[14] The OECD taxonomy links 3-digit groups of ISIC Rev.4 to different R&D intensity groups, and is available at: http://www.oecd-ilibrary.org/science-and-technology/oecd-taxonomy-of-economic-activities-based-on-r-d-intensity_5jlv73sqqp8r-en
[15] The OECD taxonomy also defines low R&D sectors, but none of the manufacturing sectors is classed as low R&D intensity in the OECD taxonomy.