The need for powerful visualisations to communicate cutting-edge climate science
Joshua Macholl
Advancing our understanding of tropical cyclones in Southern Africa under climate change using high-resolution climate modelling
As the time left to limit global warming to 1.5°C continues to decrease, it is now more important than ever to ensure that the climate change science used to inform decision making is communicated clearly, concisely, and effectively.
Back in April, a hackathon was organised at the Met Office to address this challenge. The aim was to develop computer programmes that can produce powerful visualisations to communicate cutting-edge science to the wider world. It was also a fantastic opportunity for attendees to develop their programming and quality assurance skills, as well as work collaboratively in person for one of the first times since the pre-COVID era.
In the run-up to the event, participants were encouraged to reflect on a very successful, well-known example of such a visualisation. This was the #ShowYourStripes image, by Professor Ed Hawkins, which very elegantly shows global temperature increases over the past century.

Warming stripes show changes in temperature measured in different countries over the past 100+ years. Each stripe represents the temperature in that country averaged over a year. Image produced by Prof Ed Hawkins, #ShowYourStripes
This visualisation is so successful because of its simplicity and impact in expressing the climate change message, without the need to see the numerical data. It is extremely effective at communicating a key message in a way that is accessible to non-scientists. The challenge of communicating complex information to non-technical audiences is non-trivial in the field of climate science, and this issue is the basis of what we were trying to achieve in this event.
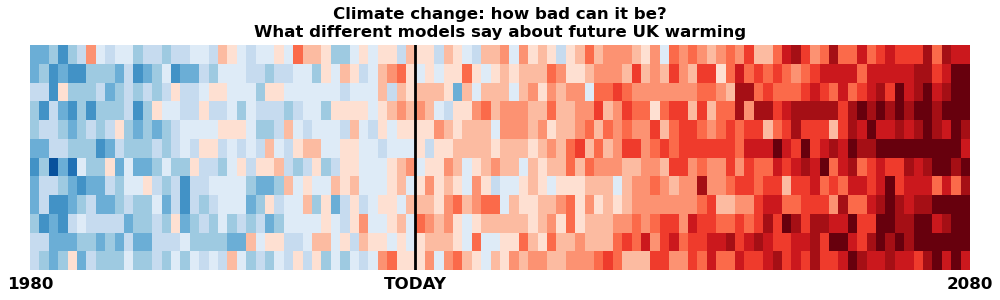
The outputs could illustrate a wide range of environmental phenomena (e.g. changes in sea level acidity, species migration or rainfall) but our approach was to build upon Ed’s visualisation to illustrate what UK temperatures could look like in the future. Uniquely, we were the only team to embed the climate stripes theme into our output.

The visualisation produced by my team shows that if we do little to limit the quantity of harmful gases we emit into the atmosphere, it is virtually certain that UK temperatures will increase by a noticeable amount over the next 80 years.
I am personally very pleased with our visualisation. In particular, it clearly shows the high level of confidence that temperatures will increase under a high emissions scenario. Whilst we tried to make the design as simple as possible, we thought that the timeline labels and title help explain the image and provides a bit more detail for the audience at first glance. There is a subtle trade-off between adding more useful information to this figure (e.g. a temperature colour scale) and over-crowding the simple message aimed to be conveyed to non-scientists. Of course, further information regarding the details of the figure could be provided through supplementary information as appropriate.
Since time was of the essence in this one-day event (9am-4pm), it was important to finish the coding in the morning to leave enough time for peer-review and presentation in the afternoon. Our approach was to nominate a main coder, whilst the other two members would handle the communications with the wider event as well as spotting/debugging coding errors. Personally, I found this approach very informative as a beginner coder, as I learned a lot of useful coding practices from my more experienced team members. I used my communication and organisational skills to inform others of what we were doing, as well as plan how I was going to effectively communicate what we had achieved to the wider group.
In the afternoon, each team’s code script was peer reviewed by another team, to check that it could be followed and understood by others. This was a key part of the event since all the outputs and associated code are designed to be shared across the organisation. If others cannot understand and edit the code to suit their needs, then the work is of little use. Whilst also giving us practice with version-control software (GitHub), each team received valuable feedback and necessary changes were implemented before close of play.
"Good artists copy, great artists steal" - Pablo Picasso
At the end of the day, I very much enjoyed presenting our visualisation to the other teams. They were amused by my reference to an artistic quote from Pablo Picasso – “Good artists copy, great artists steal” to help explain reasoning for why we chose to develop Ed's visualisation specifically.
I received entertaining comments from the audience about how our output "would make a great bookmark", but most importantly everyone understood the meaning behind this visualisation and we received positive feedback on its aesthetics and simplicity.

A drawback to this visualisation is that it may not be as suitable for the visually impaired, particularly for those audiences who suffer from types of colour-blindness. Early in the design process, we experimented to see how our visualisation could look under a perceptually uniform colour scale. However, for the purposes of this event, we decided to use a red-blue colour palette because of its association with "wam/cool" types of plots to enhance the rising temperatures message. This was a trade-off but a perceptually uniform version could be produced for specific purposes.
In summary, I am really pleased with what my team achieved during this event and would like to thank the organisers and the Met Office for taking the time to facilitate such development opportunities for staff.
Thank you to
Team members: Dr Caroline Sandford, Dr Michael Sanderson
Hackathon Organisers: Dr James Pope, Dr Tim Mitchell
Professor Ed Hawkins
Hayley Jones - Strategic Communications Manager, Met Office
#TogetherForOurPlanet #forceforgood #GetClimateReady
--
1yHi Joshua, I really enjoyed reading of this concept. As a retired hypnotherapist of many years I fully understand how your interpretation would sit well with some minds that were not left brained. Great idea putting the image on a book mark but what about a screen saver/start-up screen, because so many people especially the young are not touching a paper book. Wishing you every success.
Science Communication | Agata Communications | Making sure science reaches everybody
1yHi Joshua Macholl, I just saw the post and I think that this is a great example of two separate design teams narrowing down the same solutions! I'll explain At Predictia Intelligent Data Solutions we implemented this same solution for the IPCC Interactive Atlas that came out almost a year ago. In our case, we were worried about how to communicate the uncertainty of the models. So we thought that a good solution would be to print the cliamte stripes for each separate model, and stackthem on top of each other (with the average on top). To explore the tool, you can visit https://interactive-atlas.ipcc.ch/
Met Office Senior Climate Scientist | Fresh Eyes on CMIP - Documentation Subgroup Co-Lead | Sustainability Officer - Federation International Racketlon | Secretary & Data basing - UK Racketlon | School Parent Governor
1yReally delighted to read this great write up.