


Abstract
This paper investigates the divergence of environmental, social, and governance (ESG) ratings based on data from six prominent ESG rating agencies: Kinder, Lydenberg, and Domini (KLD), Sustainalytics, Moody’s ESG (Vigeo-Eiris), S&P Global (RobecoSAM), Refinitiv (Asset4), and MSCI. We document the rating divergence and map the different methodologies onto a common taxonomy of categories. Using this taxonomy, we decompose the divergence into contributions of scope, measurement, and weight. Measurement contributes 56% of the divergence, scope 38%, and weight 6%. Further analyzing the reasons for measurement divergence, we detect a rater effect where a rater’s overall view of a firm influences the measurement of specific categories. The results call for greater attention to how the data underlying ESG ratings are generated.
1. Introduction
Environmental, social, and governance (ESG) rating providers1 have become influential institutions. A total of 3,038 investors representing over $100 trillion in combined assets have signed a commitment to integrate ESG information into their investment decisions (PRI, 2020). Sustainable investing is growing quickly and mutual funds that invest according to ESG ratings experience sizable inflows (Hartzmark and Sussman, 2019). Due to these trends, more and more investors rely on ESG ratings to obtain a third-party assessment of corporations’ ESG performance. A growing number of academic studies rely on ESG ratings for their empirical analysis (see, e.g., Servaes and Tamayo, 2013; Flammer, 2015; Liang and Renneboog, 2017; Lins, Servaes, and Tamayo, 2017; Albuquerque, Koskinen, and Zhang, 2019). As a result, ESG ratings increasingly influence decisions, with potentially far-reaching effects on asset prices and corporate policies.
However, ESG ratings from different providers disagree substantially, as previously shown in Chatterji et al. (2016). We confirm this finding in our data set, where the correlations between ESG ratings range from 0.38 to 0.71. This is based on ESG ratings from six different raters: KLD, Sustainalytics, Moody’s ESG (previously Vigeo-Eiris), S&P Global (previously RobecoSAM), Refinitiv (previously Asset4), and MSCI. This disagreement has several important consequences. First, it makes it difficult to evaluate the ESG performance of companies, funds, and portfolios, which is the primary purpose of ESG ratings. Second, ESG rating divergence decreases companies’ incentives to improve their ESG performance. Companies receive mixed signals from rating agencies about which actions are expected and will be valued by the market. This might lead to underinvestment in ESG improvement activities ex ante. Third, markets are less likely to price firms’ ESG performance ex post. ESG performance may be fundamentally value-relevant or affect asset prices through investor tastes (Heinkel, Kraus, and Zechner, 2001). However, in both cases, the divergence of the ratings disperses the effect of ESG performance on asset prices. Fourth, the disagreement shows that it is difficult to link CEO compensation to ESG performance. Contracts are likely to be incomplete and CEOs may optimize for one particular rating while underperforming in other important ESG issues—that is, CEOs might “hit the target” set by the rating but “miss the point” of improving the firm’s ESG performance more broadly. Finally, the divergence of ratings poses a challenge for empirical research, as using one rater versus another may alter a study’s results and conclusions. The divergence of ESG ratings introduces uncertainty into any decision taken based on ESG ratings and, therefore, represents a challenge for a wide range of decision-makers.
This paper investigates what drives the divergence of sustainability ratings. Chatterji et al. (2016) have taken an important first step in this regard, providing two reasons for the divergence: What ESG raters choose to measure, and whether it is measured consistently, which the authors term “theorization” and “commensurability.” In their empirical analysis, the authors show that both differences in theorization and low commensurability play a role. However, their analysis leaves open to what extent each of these components drives divergence. As a result, it remains unclear whether a better articulation of what is measured could resolve the divergence or whether measurement itself is the central problem. A key reason for this remaining gap is that Chatterji et al. (2016) rely on a data set that contains only a small subset of the underlying indicators that make up the different ESG ratings. To advance on this front, this paper provides a quantitative decomposition of ESG rating divergence, relying on six ESG ratings along with the complete set of 709 underlying indicators.
We identify three distinct sources of divergence. “Scope divergence” refers to the situation where ratings are based on different sets of attributes. One rating agency may include lobbying activities, while another might not, causing the two ratings to diverge. “Measurement divergence” refers to a situation where rating agencies measure the same attribute using different indicators. For example, a firm’s labor practices could be evaluated on the basis of workforce turnover or by the number of labor-related court cases taken against the firm. Finally, “weight divergence” emerges when rating agencies take different views on the relative importance of attributes.2 For example, the labor practices indicator may enter the final rating with greater weight than the lobbying indicator. The contributions of scope, measurement, and weight divergence are intertwined, making it difficult to interpret the difference between two ESG ratings.
We approach the problem in three steps. First, we categorize all 709 indicators provided by the different data providers into a common taxonomy of sixty-four categories. This categorization is a critical step in our methodology, as it allows us to observe the scope of categories covered by each rating and to contrast measurements by different raters within the same category. We create a category whenever at least two indicators from different rating agencies pertain to the same attribute. Based on the taxonomy, we calculate rater-specific category scores by averaging indicators that were assigned to the same category. Second, we regress the original rating on those category scores. The regression models yield fitted versions of the original ratings and we can compare these fitted ratings to each other. Third, we decompose the divergence into the contributions of scope, measurement, and weight.
Our study yields three results. First, we show that it is possible to estimate the implied aggregation rule used by the rating agencies with an accuracy of 79–99% based on our common taxonomy. This demonstrates that although ESG ratings have incompatible structures, it is possible to fit them into a consistent framework that reveals in detail how much and for what reason ratings differ. Second, we find that measurement divergence is the main driver of rating divergence, contributing 56% of the divergence. Scope divergence is also important, contributing 38%, while weight divergence contributes a mere 6%. Third, we find that measurement divergence is in part driven by a “rater effect.” This is also known as the “halo effect,” meaning that a firm receiving a high score in one category is more likely to receive high scores in all the other categories from that same rater. The rater effect is substantial. Controlling for which firm is rated and in which category the firm is rated, the rater effect explains 15% of the variation of category scores.
We perform several robustness checks. First, we evaluate the sensitivity of the results to our taxonomy. The taxonomy is an approximation because most raters do not share their raw data, making it impossible to match indicators with the same units. However, restricting the analysis to perfectly identical indicators would yield that the divergence is entirely due to scope—that is, that there is zero common ground between ESG raters—which does not reflect the real situation. Thus, we use a taxonomy that matches indicators by attribute. To rule out that our subjective judgment drives the results, we sort the indicators according to an alternative taxonomy provided by the Sustainability Accounting Standards Board (SASB).3 The results based on this alternative taxonomy are consistent with those based on our own taxonomy. Second, our linear aggregation rule is not industry-specific, while most ESG rating agencies use industry-specific aggregation rules. However, this approximation seems to be relatively innocuous because a simple linear rule achieves a very high quality of fit. More sophisticated non-linear estimators, such as neural networks, do not yield better results. Third, our main analysis is based on the year 2014, which maximizes our sample size and includes KLD as one of the ratings that has been used in academia most frequently so far. However, replicating the analysis for the year 2017 without KLD yields very similar results. Fourth, we present a regression-based decomposition method as an alternative methodology, which also supports our results.
We extend existing research that has investigated the divergence of ESG ratings (Chatterji et al., 2016; Gibson Brandon, Krueger, and Schmidt, 2021; Christensen, Serafeim, and Sikochi, 2022). Our first contribution to this literature is to quantify the drivers of divergence. Our results show that ESG rating divergence is primarily driven by measurement divergence and it is, for that reason, difficult to resolve. The easiest issue to address is weight divergence. Two ratings could be made consistent by aligning their weighting schemes. However, because weight divergence contributes only 6% to the total divergence, adjusting weights will achieve little. Scope divergence is much more important but harder to address. Scope divergence implies that categories are measured exclusively by one rater. Thus, one can only achieve more agreement by concentrating the ESG assessment on a reduced set of common categories. Nevertheless, measurement divergence remains the most relevant driver of divergence even within this smaller set. Thus, addressing ESG rating divergence requires one to understand how the data that underpin ESG ratings are generated. Our second contribution is a methodology that facilitates dealing with ESG rating divergence. At the firm level, it allows tracing divergence to individual categories. At the aggregate level, it allows identifying the categories in which measurement divergence is most consequential, providing priority areas for future research. Our third contribution is the discovery of a rater effect. This suggests that measurement divergence is not randomly distributed noise but follows rater- and firm-specific patterns. These patterns suggest structural reasons for measurement divergence, such as how rating agencies organize their work.
These results have important implications for future research in sustainable finance. ESG ratings and metrics are an important foundation for the field of sustainable finance. Theory predicts that investor preferences for ESG affect asset prices. In practice, however, investment choices are guided by ESG ratings, making the construction of and disagreement among ESG ratings a central concern. Therefore, future research should attempt to improve the empirical basis of sustainable finance. Researchers should vet data providers carefully and avoid relying too much on one single rater as a community. However, it is not sufficient to consider multiple ratings. The disagreement extends to specific environment, social, and governance categories, meaning that noisy measurement also poses a challenge for research on ESG metrics such as carbon emissions or gender equality. To address this, researchers should invest in developing their own category-specific metrics and ideally make them available to others. In addition, the rater effect raises questions about the economics of the ESG ratings market. Structural reasons or incentives that need to be better understood may influence how certain companies or categories are rated. Beyond improving measurement, the divergence itself begs the question of how uncertainty in ESG ratings affects asset prices, a topic that is gaining attention in the literature (Avramov et al., 2021; Gibson Brandon, Krueger, and Schmidt, 2021). Finally, our results raise the question of how companies respond to being scored differently by different raters (see also Chatterji, Levine, and Toffel, 2009), which will inform the effects of sustainable finance on the real economy.
ESG rating divergence does not imply that measuring ESG performance is a futile exercise. However, it highlights that measuring ESG performance is challenging, that attention to the underlying data are essential, and that the use of ESG ratings and metrics must be carefully considered for each application. Investors can use our methodology to reconcile divergent ratings and focus their research on those categories where ratings disagree. For regulators, our study points to the potential benefits of harmonizing ESG disclosure and establishing a taxonomy of ESG categories. Harmonizing ESG disclosure would help provide a foundation of reliable data. A taxonomy of ESG categories would make it easier to contrast and compare ratings.
The paper is organized as follows: Section 2 describes the data; Section 3 documents the ESG rating divergence; and Section 4 explains the taxonomy and how we estimate the aggregation procedures. In Section 5, we decompose the overall divergence into the contributions of “scope,” “measurement,” and “weight” and Section 6 explores the rater effect. We conclude in Section 7 and highlight the implications of our findings.
2. Data
ESG ratings first emerged in the 1980s as a way for investors to screen companies on environmental, social, and corporate governance performance. The earliest ESG rating agency, Eiris (merged with Vigeo in 2015), was established in 1983 in France, and 7 years later, Kinder, Lydenberg, and Domini (KLD) was established in the USA. While initially catering to a highly specialized investor clientele, including faith-based organizations, the market for ESG ratings has widened dramatically, especially in the past decade. Because ESG ratings are an essential basis for most kinds of sustainable investing, the market for ESG ratings grew in parallel to sustainable investing. As sustainable investing transitioned from niche to mainstream, many early ESG rating providers were acquired by established financial data providers. For example, MSCI bought KLD in 2010, Morningstar acquired 40% of Sustainalytics in 2017, Moody’s bought Vigeo-Eiris in 2019, and S&P Global bought RobecoSAM in 2019.
ESG rating agencies allow investors to screen companies for ESG performance, like credit ratings allow investors to screen companies for creditworthiness. However, at least three important differences between ESG ratings and credit ratings exist. First, while creditworthiness is relatively clearly defined as the probability of default, the definition of ESG performance is less clear. It is a concept based on values that are diverse and evolving. Thus, an important part of the service that ESG rating agencies offer is an interpretation of what ESG performance means. Second, while financial reporting standards have matured and converged over the past century, ESG reporting is in its infancy. There are competing reporting standards for ESG disclosure, many of which are voluntary or limited to single jurisdictions, giving corporations broad discretion regarding whether and what to report. Thus, ESG ratings provide a service to investors by collecting and aggregating information from across a spectrum of sources and reporting standards. These two differences explain why the divergence between ESG ratings is so much more pronounced than the divergence between credit ratings, the latter being correlated at 99%.4 Third, ESG raters are paid by the investors who use the ratings, not by the companies that are rated, as is the case with credit raters. As a result, the problem of ratings shopping, which has been discussed as a potential reason for credit ratings diverging (see, e.g., Bongaerts, Cremers, and Goetzmann, 2012), does not apply to ESG rating providers.
We use data from six different ESG rating providers: KLD5, Sustainalytics, Moody’s ESG, Refinitiv, MSCI, and S&P Global. We include KLD because it is the data set that has been used most frequently in academic studies. Our selection of the other raters was guided by market relevance. All the providers in our sample are widely recognized and used by sustainable finance professionals.6 We approached each provider and requested access to the ratings, the underlying indicators, and documentation about the aggregation rules and measurement protocols of the indicators.
Table I provides descriptive statistics of the aggregate ratings7 and their sample characteristics. The baseline year for our analysis is 2014, which is the year with the largest common sample when KLD is also included. Because most of the academic literature to date relies on KLD data, it is important to include it in our study. We also confirm our results for the year 2017 without KLD. Panel A shows the full sample, where the number of firms ranges from 1,665 to 9,662. Panel B shows the common sample of 924 firms. The mean and median ESG ratings are higher in the common sample for all providers, indicating that the balanced sample tends to drop lower-performing companies. For our further analysis, we normalize the common sample to have zero mean and unit variance in the cross-section.
Descriptive statistics
Descriptive statistics of the aggregate ratings (ESG level) in 2014 for the six rating agencies. Panel A shows the data for the full sample and Panel B for the common sample.
| Panel A: Full sample | ||||||
|---|---|---|---|---|---|---|
| Sustainalytics | S&P Global | Moody’s ESG | KLD | Refinitiv | MSCI | |
| Firms | 4,531 | 1,665 | 2,304 | 5,053 | 4,013 | 9,662 |
| Mean | 56.4 | 47.19 | 32.23 | 1.16 | 50.9 | 4.7 |
| Standard Dev. | 9.46 | 21.06 | 11.78 | 1.76 | 30.94 | 1.19 |
| Minimum | 29 | 13 | 5 | 6 | 2.78 | 0 |
| Median | 55 | 40 | 31 | 1 | 53.15 | 4.7 |
| Maximum | 89 | 94 | 67 | 12 | 97.11 | 9.8 |
Panel B: Common sample | ||||||
| Firms | 924 | 924 | 924 | 924 | 924 | 924 |
| Mean | 61.86 | 50.49 | 34.73 | 2.56 | 73.47 | 5.18 |
| Standard Dev. | 9.41 | 20.78 | 11.31 | 2.33 | 23.09 | 1.22 |
| Minimum | 37 | 14 | 6 | 4 | 3.46 | 0.6 |
| Median | 62 | 47 | 33 | 2 | 81.48 | 5.1 |
| Maximum | 89 | 94 | 66 | 12 | 97.11 | 9.8 |
3. Divergence
Our point of departure is that ESG ratings diverge. In this section, we establish that the divergence in our sample is substantial and consistent with prior studies. First, we compute Krippendorff’s alpha (Krippendorff, 2004). The advantage of this measure is that it expresses the overall reliability of assessment for any number of raters in one statistic. For the 6 raters and 924 firms in our sample, we obtain a value of 0.55. In general, values above 0.8 are preferred and values above 0.667 are considered a minimum to arrive at tentative conclusions about the true value based on raters’ assessments (Krippendorff, 2004, p. 204). In other words, the disagreement is substantial.
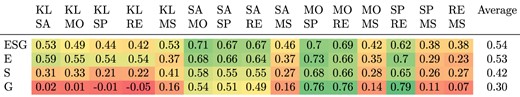
Table II shows pairwise Pearson correlations between the aggregate ESG ratings and between their environmental (E), social (S), and governance (G) dimensions. Correlations at the ESG level are on average 0.54 and range from 0.38 to 0.71. Sustainalytics and Moody’s ESG have the highest level of agreement with each other, with a correlation of 0.71. The environmental dimension has the highest correlation of the three dimensions, with an average of 0.53. The social dimension has an average correlation of 0.42, and the governance dimension has the lowest correlation, with an average of 0.30. KLD and MSCI exhibit the lowest correlations with other raters, both for the aggregate ESG rating and individual dimensions. Considering sampling differences, these results are consistent with ESG rating correlations reported by Chatterji et al. (2016) and Gibson Brandon, Krueger, and Schmidt (2021).
Correlations between ESG ratings
Correlations between ESG ratings at the aggregate rating level (ESG) and at the level of the environmental dimension (E), the social dimension (S), and the governance dimension (G) using the common sample. The results are similar using pairwise common samples based on the full sample. SA, SP, MO, RE, KL, and MS are short for Sustainalytics, S&P Global, Moody’s ESG, Refinitiv, KLD, and MSCI, respectively.
 |
|
Correlations between ESG ratings
Correlations between ESG ratings at the aggregate rating level (ESG) and at the level of the environmental dimension (E), the social dimension (S), and the governance dimension (G) using the common sample. The results are similar using pairwise common samples based on the full sample. SA, SP, MO, RE, KL, and MS are short for Sustainalytics, S&P Global, Moody’s ESG, Refinitiv, KLD, and MSCI, respectively.
|
|
We illustrate the rating divergence in Figure 1. Not to overstate the problem, we use the Sustainalytics rating, which has the highest correlations with the five other ratings, as a benchmark. We plot the values from the other raters against this benchmark rating. Figure 1 illustrates that ESG ratings are positively correlated. As the benchmark rating increases, the other ratings also tend to increase. Nevertheless, the figure also shows substantial divergence. For any level of the benchmark rating, there is a wide range of values given by the other ratings. Suppose a company receives a Sustainalytics rating score of +1.5, which places it among the top 10% of companies rated by Sustainalytics. Yet, other ratings at x = 1.5 score the company below zero, placing the company below the sample average. In other words, the extent of the divergence is such that it is difficult to tell a leader from an average performer. This issue becomes even more pronounced when using other ratings as a benchmark or when looking at rankings. For an illustration, refer to Online Appendix Figure A.1.
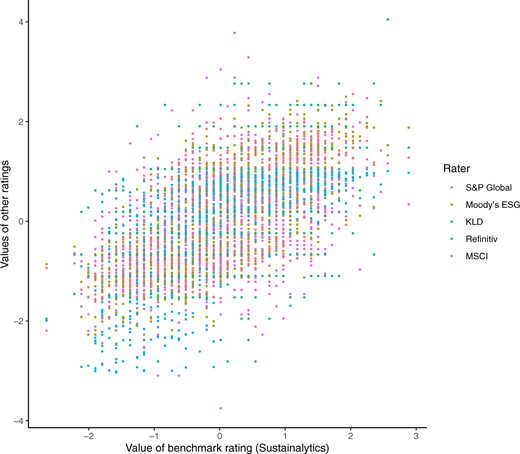
ESG rating disagreement.
Notes: This graph illustrates the ESG rating divergence. The horizontal axis indicates the value of the Sustainalytics rating as a benchmark for each firm (n = 924). Rating values by the other five raters are plotted on the vertical axis in different colors. For each rater, the distribution of values has been normalized to zero mean and unit variance. The Sustainalytics rating has discrete values that show up visually as vertical lines where several companies have the same rating value.
The purpose of ESG ratings is to assess a company’s ESG performance. Yet, ESG ratings disagree to an extent that leaves observers with considerable uncertainty as to how good the company’s ESG performance is. It is natural for those interested in ESG performance to wonder what causes ESG ratings to disagree so widely. This is what we investigate next.
4. Scope, Measurement, and Weights
In this section, we explain how we specify ESG ratings in terms of scope, measurement, and weight based on a common taxonomy. This framework, illustrated in Figure 2, allows us to explain why ratings diverge.
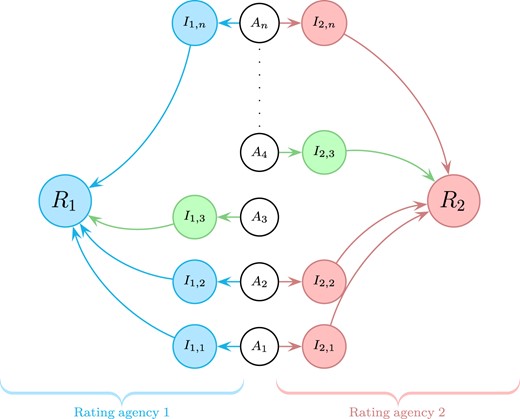
The sources of divergence.
Notes: Our schematic representation of an ESG rating consists of the elements scope, measurement, and weight. Scope is the set of attributes An that describe a company’s ESG performance. Measurement determines the indicators … , which produce numerical values for each attribute and are specific to rating agency k. Weights determine how indicators are aggregated into a single ESG rating Rk. Scope divergence results from two raters considering a different set of attributes. Measurement divergence results from two raters using different indicators to measure the same attribute. Weight divergence results from two raters aggregating the same indicators using different weights.
4.1 Scope
The decomposition of ESG rating divergence is not trivial because at the granular level, the structures of different ESG ratings are incompatible. Each rater chooses to break down the concept of ESG performance into different indicators and organizes them in different hierarchies. For example, at the first level of disaggregation, Moody’s ESG, S&P Global, MSCI, and Sustainalytics have three dimensions (E, S, and G), Refinitiv has four, and KLD has seven. Below these first-level dimensions, there are between one and three levels of more granular sub-categories, depending on the rater. At the lowest level, our data set contains between 38 and 282 indicators per rater, which often, but not always, relate to similar underlying attributes. These incompatible structures make it difficult to understand how and why different raters assess the same company in different ways.
We impose our own taxonomy on the data to perform a meaningful comparison of these different rating systems. We develop this taxonomy using a bottom-up approach. First, we create a long list of all available indicators and their detailed descriptions. In cases where the descriptions were not available (or were insufficient), we interviewed the data providers for clarification. In total, the list contains 709 indicators. Second, we group indicators that describe the same attribute in the same “category.” For example, we group all indicators related to the category Water, as shown in Table III. Third, we iteratively refine the taxonomy, following two rules: (a) each indicator is assigned to only one category and (b) a new category is established when at least two indicators from different raters both describe an attribute that is not yet covered by existing categories. For example, indicators related to Forests were taken out of the larger category of Biodiversity to form their own category. The classification is purely based on the attribute that indicators intend to measure, regardless of the method or data source used. Indicators that are unique to one rater and could not be grouped with indicators from other raters were labeled “unclassified” and each given their own rater-specific category.
Example of indicator assignment
This table shows the indicators from different rating agencies assigned to the category Water.
| Rater | Indicator name | Category |
|---|---|---|
| Refinitiv | Emission Reduction/Discharge into Water System | Water |
| Refinitiv | Resource Reduction/Water Recycling | Water |
| Refinitiv | Resource Reduction/Water Use | Water |
| KLD | ENV.CON.Water Management | Water |
| KLD | ENV.STR.Water Stress | Water |
| MSCI | Water Stress Mgmt | Water |
| S&P Global | Water Operations | Water |
| S&P Global | Water Related Risks | Water |
| Sustainalytics | Water Intensity-Raw Score | Water |
| Sustainalytics | Water Management Programmes-Raw Score | Water |
| Moody’s ESG | Water | Water |
The resulting taxonomy, shown in Table IV, assigns the 709 indicators to a total of sixty-four distinct categories. Refinitiv has the most individual indicators with 282, followed by Sustainalytics with 163. KLD, S&P Global, and MSCI have seventy-eight, eighty, and sixty-eight, respectively, and Moody’s ESG has thirty-eight. Some categories—Forests, for example—contain only one indicator from two raters. Others, such as Supply Chain, contain several indicators from all raters. Arguably, Forests is a much narrower category than Supply Chain. The reason for this difference in broadness is that there were no indicators in Supply Chain that together represented a more narrow common category. Therefore, the Supply Chain comparison is at a more general level and it may seem obvious that different raters take a different view of this category. Nevertheless, this broad comparison represents the most specific level possible given the data.
Number of indicators per rater and category
This table shows how many indicators are provided by the different rating agencies per category. Categories that are covered by all raters are printed in bold.
| Category | Sustainalytics | S&P Global | Refinitiv | Moody’s ESG | MSCI | KLD |
|---|---|---|---|---|---|---|
| Access to Basic Services | 2 | 1 | 1 | 1 | ||
| Access to Healthcare | 6 | 3 | 1 | 1 | 1 | |
| Animal Welfare | 2 | 1 | ||||
| Anti-competitive Practices | 2 | 1 | 1 | 1 | ||
| Audit | 4 | 5 | 1 | |||
| Biodiversity | 1 | 1 | 3 | 1 | 1 | 2 |
| Board | 6 | 25 | 1 | 1 | ||
| Board Diversity | 2 | 1 | 3 | |||
| Business Ethics | 4 | 2 | 1 | 1 | 1 | |
| Chairperson-CEO Separation | 1 | 1 | ||||
| Child Labor | 1 | 1 | 1 | |||
| Climate Risk Mgmt. | 2 | 1 | 1 | 2 | ||
| Clinical Trials | 1 | 1 | ||||
| Collective Bargaining | 2 | 1 | 1 | |||
| Community and Society | 3 | 6 | 10 | 1 | 1 | |
| Corporate Governance | 1 | 1 | ||||
| Corruption | 2 | 1 | 1 | 1 | 1 | |
| Customer Relationship | 1 | 1 | 7 | 1 | 2 | |
| Diversity | 2 | 9 | 1 | 3 | ||
| ESG Incentives | 1 | 1 | ||||
| Electromagnetic Fields | 1 | 1 | ||||
| Employee Development | 1 | 2 | 13 | 1 | 1 | 3 |
| Employee Turnover | 1 | 1 | ||||
| Energy | 3 | 6 | 5 | 1 | 2 | 1 |
| Environmental Fines | 1 | 1 | 1 | |||
| Environmental Mgmt. System | 2 | 1 | 1 | |||
| Environmental Policy | 4 | 2 | 4 | 2 | ||
| Environmental Reporting | 2 | 1 | 1 | |||
| Financial Inclusion | 1 | 1 | 1 | |||
| Forests | 1 | 1 | ||||
| GHG Emissions | 5 | 5 | 1 | 1 | ||
| GHG Policies | 3 | 2 | 4 | |||
| GMOs | 1 | 1 | 1 | |||
| Global Compact Membership | 1 | 1 | ||||
| Green Buildings | 5 | 2 | 1 | 1 | 1 | |
| Green Products | 7 | 1 | 20 | 1 | 2 | 1 |
| HIV Programs | 1 | 1 | ||||
| Hazardous Waste | 1 | 1 | 1 | 1 | ||
| Health and Safety | 7 | 1 | 7 | 1 | 1 | 2 |
| Human Rights | 2 | 1 | 5 | 1 | 5 | |
| Indigenous Rights | 1 | 1 | 1 | |||
| Labor Practices | 3 | 1 | 16 | 4 | 1 | 3 |
| Lobbying | 3 | 1 | 1 | |||
| Non-GHG Air Emissions | 1 | 2 | ||||
| Ozone-Depleting Gases | 1 | 1 | ||||
| Packaging | 1 | 1 | 1 | |||
| Philanthropy | 3 | 1 | 2 | 1 | 1 | |
| Privacy and IT | 1 | 3 | 1 | 2 | ||
| Product Safety | 2 | 2 | 13 | 3 | 2 | 6 |
| Public Health | 1 | 3 | 1 | 2 | ||
| Remuneration | 4 | 1 | 15 | 2 | 1 | 4 |
| Reporting Quality | 3 | 5 | 1 | |||
| Resource Efficiency | 1 | 3 | 6 | |||
| Responsible Marketing | 3 | 3 | 1 | 1 | 1 | |
| Shareholders | 16 | 1 | ||||
| Site Closure | 1 | 1 | ||||
| Supply Chain | 21 | 3 | 4 | 4 | 3 | 6 |
| Sustainable Finance | 9 | 5 | 3 | 3 | 4 | |
| Systemic Risk | 1 | 1 | 1 | |||
| Taxes | 2 | 1 | 1 | |||
| Toxic Spills | 1 | 2 | 1 | |||
| Unions | 1 | 1 | ||||
| Waste | 3 | 2 | 4 | 1 | 3 | |
| Water | 2 | 2 | 3 | 1 | 1 | 2 |
| Unclassified | 7 | 7 | 42 | 1 | 35 | 2 |
| Sum | 163 | 80 | 282 | 38 | 68 | 78 |
Table IV shows how many indicators each rater provides per category. On the one hand, some categories are considered by all six raters, indicating that these are commonly accepted core ESG issues. These are Biodiversity, Employee Development, Energy, Green Products, Health and Safety, Labor Practices, Product Safety, Remuneration, Supply Chain, and Water. On the other hand, many empty cells show that far from all categories are covered by all ratings. Gaps exist both for categories that could be described as specialized, such as Electromagnetic Fields and also for the Taxes category, which could be viewed as a fundamental concern in the context of ESG issues. Also, the considerable number of unclassified indicators shows that many ESG aspects are only measured by one out of six raters. Refinitiv has, with forty-two, the most unclassified indicators, almost all of which stem from Refinitiv’s economic dimension. This dimension contains indicators, such as net income growth or capital expenditure that other rating agencies do not consider. MSCI has thirty-four unclassified indicators; these are what MSCI terms “exposure scores.” Next to scores that evaluate how well a company manages an issue, MSCI has scores that measure how relevant the issue is for the specific company. None of the other raters have indicators that explicitly measure this.
The taxonomy imposes a structure on the data that allows a systematic comparison. Obviously, results may be sensitive to the particular way we built it. To make sure our results are not driven by a particular classification, we created an alternative taxonomy as a robustness check. Instead of constructing the categories from the bottom up, we produce a top-down taxonomy based on SASB. SASB has identified twenty-six general issue categories based on a comprehensive stakeholder consultation process. As such, these categories represent the consensus of a wide range of investors and regulators on the scope of relevant ESG categories. We map all indicators against these twenty-six general issue categories, again requiring that each indicator can only be assigned to one category. This alternative taxonomy, along with results that are based on it, is provided in the Online Appendix. All our results also hold for this alternative taxonomy.
4.2 Measurement
We can study measurement divergence using our taxonomy by comparing the assessments of different raters at the level of categories. We create category scores (C) for each category, firm, and rater. Category scores are calculated by taking the average of the indicator values assigned to the category. Let us define the notations:
Category scores, variables, and indexes:
The following variables and indexes are used throughout the paper: The category score is computed as
| Notation | Variable | Index | Range |
|---|---|---|---|
| A | Attributes | i | |
| I | Indicators | i | |
| C | Categories | j | |
| Nfkj | Indicators | i |
| Notation | Variable | Index | Range |
|---|---|---|---|
| A | Attributes | i | |
| I | Indicators | i | |
| C | Categories | j | |
| Nfkj | Indicators | i |
| Notation | Variable | Index | Range |
|---|---|---|---|
| A | Attributes | i | |
| I | Indicators | i | |
| C | Categories | j | |
| Nfkj | Indicators | i |
| Notation | Variable | Index | Range |
|---|---|---|---|
| A | Attributes | i | |
| I | Indicators | i | |
| C | Categories | j | |
| Nfkj | Indicators | i |
for firm , rating agency , and category j.
Category scores represent a rating agency’s assessment of a certain ESG category. They are based on different sets of indicators that each rely on different measurement protocols. It follows that differences between category scores stem from differences in “how” rating agencies choose to measure, rather than what they choose to measure. Thus, differences between the same categories from different raters can be interpreted as measurement divergence. Some rating agencies employ different sets of indicators for different industries. Such industry-specific considerations about measurement are also reflected in the category scores because those scores take the average of all available indicator values.
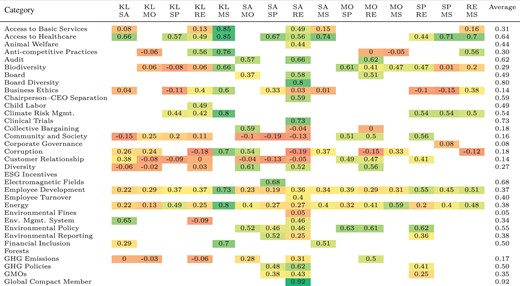
Table V shows the correlations between the categories. The correlations are calculated on the basis of complete pairwise observations per category and rater pair. The table offers two insights. First, correlation levels are heterogeneous. Environmental policy, for instance, has an average correlation level of 0.55. This indicates at least some level of agreement regarding the existence and quality of the firms’ environmental policy. However, even categories that measure straightforward facts that are easily obtained from public records do not all have high levels of correlation. For instance, membership of the UN Global Compact and CEO/Chairperson separation should be unambiguous but show correlations of 0.92 and 0.59, respectively. There are also several negative correlations, such as Lobbying between Sustainalytics and Moody’s ESG or Indigenous Rights between Sustainalytics and Refinitiv. In these cases, the level of disagreement is so severe that rating agencies reach not merely different but opposite conclusions.
Correlation of category scores
Correlations of category scores for pairs of rating agencies. Category scores are an average of the indicators for firm f and rater k assigned to the same category. Empty cells reflect differences in scope or missing data. SA, SP, MO, RE, KL, and MS are short for Sustainalytics, S&P Global, Moody’s ESG, Refinitiv, KLD, and MSCI, respectively.
 |
|
Correlation of category scores
Correlations of category scores for pairs of rating agencies. Category scores are an average of the indicators for firm f and rater k assigned to the same category. Empty cells reflect differences in scope or missing data. SA, SP, MO, RE, KL, and MS are short for Sustainalytics, S&P Global, Moody’s ESG, Refinitiv, KLD, and MSCI, respectively.
|
|
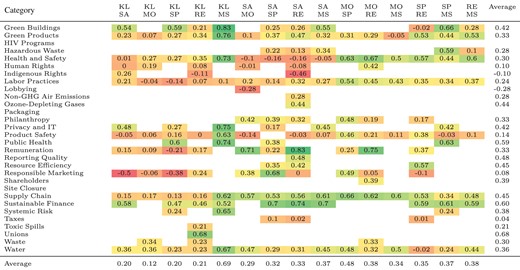
The second insight is that correlations tend to increase with granularity. For example, the correlations of the Water and Energy categories are on average 0.36 and 0.38, respectively. This is substantially lower than the correlation of the environmental dimension, with an average of 0.53 reported in Table II. This implies that divergences compensate for each other to some extent during aggregation. Several potential reasons can explain this observation. One reason might be that category scores behave like noisy measures of an underlying latent quality so that the measurement disagreement on individual categories cancels out during aggregation. It may also be the case that rating agencies assess a firm relatively strictly in one category and relatively leniently in another. A concern might be that the low correlations at the category level result from misclassification in our taxonomy, in the sense that highly correlated indicators were sorted into different categories. While we cannot rule this out completely, the alternative taxonomy based on SASB criteria mitigates this concern. It is a much less granular classification, which, therefore, should decrease the influence of any misclassification. However, the average correlation per rater pair changes only a little and not systematically when using this alternative taxonomy. This provides reassurance that the observed correlation levels are not an artifact of misclassification in our taxonomy. The correlations with the taxonomy based on SASB criteria can be seen in Table A.3 of the Online Appendix.
4.3 Weight
We can proceed with an analysis of weight divergence based on the category scores. To do so, we estimate the aggregation rule that transforms the category scores Cfkj into the rating Rfk for each rater k. Category scores, as defined in Section 4.2, serve as independent variables. When no indicator values are available to compute the category score for a given firm, the score is set to zero. This is necessary to run regressions without dropping all categories with missing values, which are numerous. Of course, this entails an assumption that missing data indicate poor performance. Categories for which no values are available for any firm in the common sample are dropped. After this treatment, category scores are normalized to zero mean and unit variance, corresponding to the normalized ratings. Each unclassified indicator is treated as a separate rater-specific category.
Because all the data have been normalized, we exclude the constant term. Due to the non-negativity constraint, we calculate the standard errors by bootstrap. We focus on the R2 as a measure of the quality of fit.
The results are shown in Table VI. MSCI has the lowest R2, with 0.79. Sustainalytics is the second lowest, with 0.90. The regressions for KLD, Moody’s ESG, Refinitiv, and S&P Global have R2 values of 0.99, 0.96, 0.92, and 0.98, respectively. These high R2 values indicate that a linear model based on our taxonomy is able to replicate the original ratings quite accurately.
Non-negative least squares regression
Non-negative linear regressions of the ESG rating on the categories of the same rater. The constant term is excluded because the data have been normalized. The standard errors are bootstrapped. Non-existent categories are denoted by dashes. The three most important categories per rater, indicated by coefficient size, are printed in bold.
| Category | Sustainalytics | S&P Global | Refinitiv | Moody’s ESG | MSCI | KLD |
|---|---|---|---|---|---|---|
| Access to Basic Services | 0.019 | – | 0 | – | 0.138*** | 0.065*** |
| Access to Healthcare | 0.051*** | 0.004 | 0 | – | 0.079*** | 0.051*** |
| Animal Welfare | 0.05*** | – | 0 | – | – | – |
| Anti-competitive Practices | – | – | 0.05*** | 0.023*** | 0 | 0.131*** |
| Audit | 0 | – | 0.026* | 0.084*** | – | – |
| Biodiversity | 0 | 0 | 0 | 0.028*** | 0.366*** | 0.076*** |
| Board | 0.072*** | – | 0.196*** | 0.113*** | 0 | – |
| Board Diversity | 0.043*** | – | 0 | – | – | 0 |
| Business Ethics | 0.097*** | 0.046*** | 0.008 | – | 0 | 0.148*** |
| Chairperson-CEO Separation | 0.039*** | – | 0.016 | – | – | – |
| Child Labor | – | – | 0.008 | 0 | – | 0.046*** |
| Climate Risk Mgmt. | – | 0.137*** | 0.064*** | – | 0.069** | 0.234*** |
| Clinical Trials | 0 | – | 0 | – | – | – |
| Collective Bargaining | 0.051*** | – | 0.011* | 0.072*** | – | – |
| Community and Society | 0.079*** | 0.086*** | 0.03* | 0.001 | – | 0.14*** |
| Corporate Governance | – | 0.048*** | – | – | 0.198*** | – |
| Corruption | 0.049*** | – | 0.022* | 0.072*** | 0.388*** | 0.124*** |
| Customer Relationship | 0.127*** | 0.097*** | 0.086*** | 0.027*** | – | 0.104*** |
| Diversity | 0.108*** | – | 0.066*** | 0.159*** | – | 0.04*** |
| ESG Incentives | 0.006 | 0 | – | – | – | – |
| Electromagnetic Fields | 0.021** | 0 | – | – | – | – |
| Employee Development | 0.018* | 0.221*** | 0.116*** | 0.067*** | 0.406*** | 0.149*** |
| Employee Turnover | 0.024* | – | 0 | – | – | – |
| Energy | 0.032** | 0.016*** | 0.029** | 0.103*** | 0.194*** | 0.046*** |
| Environmental Fines | 0 | – | 0 | – | – | 0 |
| Environmental Mgmt. System | 0.199*** | – | 0.009 | – | – | 0.205*** |
| Environmental Policy | 0.091*** | 0.098*** | 0.012 | 0.187*** | – | – |
| Environmental Reporting | 0.043** | 0.039*** | 0.007 | – | – | – |
| Financial Inclusion | 0 | – | – | – | 0.089*** | 0.061*** |
| Forests | 0.008 | 0.016* | – | – | – | – |
| GHG Emissions | 0.048*** | – | 0.002 | 0.033*** | – | 0.021** |
| GHG Policies | 0.086*** | 0.008** | 0.047** | – | – | – |
| GMOs | 0 | 0 | 0 | – | – | – |
| Global Compact Membership | 0.029** | – | 0 | – | – | – |
| Green Buildings | 0.072*** | 0.071*** | 0 | – | 0.304*** | 0.072*** |
| Green Products | 0.167*** | 0.037*** | 0.093*** | 0.024** | 0.351*** | 0.129*** |
| HIV Programs | 0 | – | 0.003 | – | – | – |
| Hazardous Waste | 0.021* | 0 | 0 | – | 0.09*** | – |
| Health and Safety | 0.049*** | 0.042*** | 0.049*** | 0.125*** | 0.148*** | 0.174*** |
| Human Rights | 0.072*** | 0 | 0.066*** | 0 | – | 0.14*** |
| Indigenous Rights | 0.033* | – | 0.006 | – | – | 0.087*** |
| Labor Practices | 0.005 | 0.063*** | 0.067*** | 0.153*** | 0.166*** | 0.129*** |
| Lobbying | 0.091*** | 0 | – | 0.013 | – | – |
| Non-GHG Air Emissions | 0.014 | – | 0 | – | – | – |
| Ozone-depleting Gases | 0 | – | 0 | – | – | – |
| Packaging | – | 0 | – | – | 0.128** | 0.033*** |
| Philanthropy | 0.028* | 0.075*** | 0.039*** | 0.073*** | – | 0 |
| Privacy and IT | 0.022* | 0.039*** | – | – | 0.276*** | 0.124*** |
| Product Safety | 0.048*** | 0.002 | 0.059*** | 0.062*** | 0.429*** | 0.216*** |
| Public Health | 0.022** | 0.011* | – | – | 0.029 | 0.074*** |
| Remuneration | 0 | 0.054*** | 0.117*** | 0.113*** | 0 | 0.223*** |
| Reporting Quality | 0.123*** | – | 0.107*** | – | – | 0 |
| Resource Efficiency | 0.014 | 0.114*** | 0.135*** | – | – | – |
| Responsible Marketing | 0 | 0.033*** | 0 | 0.002 | – | 0.081*** |
| Shareholders | – | – | 0.111*** | 0.089*** | – | – |
| Site Closure | 0.008 | 0 | – | – | – | – |
| Supply Chain | 0.253*** | 0.061*** | 0.042** | 0.05*** | 0.188*** | 0.128*** |
| Sustainable Finance | 0.108*** | 0.079*** | 0.063*** | – | 0.275*** | 0.098*** |
| Systemic Risk | – | 0.053*** | – | – | 0.349*** | 0.103*** |
| Taxes | 0.052*** | 0.01 | 0.03** | – | – | – |
| Toxic Spills | 0 | – | 0.001 | – | – | 0.113*** |
| Unions | – | – | 0.013 | – | – | 0.158*** |
| Waste | 0 | 0.005 | 0.035*** | 0.009 | – | 0.186*** |
| Water | 0.03** | 0.016*** | 0.028** | 0 | 0.035 | 0.175*** |
| Unclassified Indicators | Yes | Yes | Yes | Yes | Yes | Yes |
| R2 | 0.90 | 0.98 | 0.92 | 0.96 | 0.79 | 0.99 |
| Firms | 924 | 924 | 924 | 924 | 924 | 924 |
Significance levels: *P < 0.05, **P < 0.01, ***P < 0.001.
The regression coefficients can be interpreted as category weights. Because all variables have been normalized, the magnitude of the coefficients is comparable and indicates the relative importance of a category. Most coefficients are highly significant. Some coefficients are not significant at the 5% threshold, which means that our estimated weight is uncertain. However, those coefficients are much smaller in magnitude than the significant coefficients; most of them are close to zero and thus do not seem to have an important influence on the aggregate ESG rating.
There are substantial differences in the weights for different raters. For example, the three most important categories for KLD are Climate Risk Management, Product Safety, and Remuneration. For Moody’s ESG, the top three are Diversity, Environmental Policy, and Labor Practices. This means there is no overlap in the three most important categories for these two raters. Only Resource Efficiency and Climate Risk Management are among the three most important categories for more than one rater. At the same time, some categories have zero weight for all raters, such as Clinical Trials and Environmental Fines, genetically modified organisms (GMOs), and Ozone-depleting Gases. These observations highlight that different raters have substantially different views about the most important categories. In other words, there is weight divergence between raters.
The estimation of the aggregation function entails several assumptions. To ensure the robustness of our results, we evaluate several alternative specifications. The results are summarized in Table VII. None offers substantial improvements in the quality of fit over the non-negative linear regression.
Quality of fit
Comparison of the quality of fit in terms of R2 for the estimation of rater-specific aggregation functions using different specifications. NNLS stands for non-negative least squares and OLS for ordinary least squares. NN stands for neural network with linear activation function and NN ReLU for a neural network with a non-linear ReLU activation function. RF stands for random forest. The symbol * indicates that the R2 is reported for a testing set consisting of a randomly chosen 10% of the sample. The three last lines report results from the original method with different underlying data. For NNLS SASB, the category scores were calculated based on the SASB taxonomy; for NNLS indicators, the original indicators were used without any taxonomy, and for NNLS 2017, the underlying data are from 2017 instead of from 2014. Given that KLD does not offer any data for 2017, no value is reported.
| Specification | KLD | Moody’s ESG | S&P Global | Sustainalytics | MSCI | Refinitiv |
|---|---|---|---|---|---|---|
| NNLS | 0.99 | 0.96 | 0.98 | 0.90 | 0.79 | 0.92 |
| OLS | 0.99 | 0.96 | 0.98 | 0.91 | 0.79 | 0.92 |
| NNLS* | 0.98 | 0.94 | 0.98 | 0.89 | 0.74 | 0.83 |
| NN* | 0.98 | 0.94 | 0.98 | 0.88 | 0.83 | 0.83 |
| NN ReLU* | 0.96 | 0.96 | 0.98 | 0.83 | 0.85 | 0.80 |
| RF* | 0.73 | 0.91 | 0.97 | 0.85 | 0.56 | 0.86 |
| NNLS SASB | 0.98 | 0.96 | 0.98 | 0.87 | 0.76 | 0.92 |
| NNLS Indicators | 1 | 0.96 | 0.99 | 0.90 | 0.82 | 0.94 |
| NNLS 2017 | 0.96 | 0.98 | 0.91 | 0.68 | 0.82 |
First, we run an ordinary least squares regression to relax the non-negativity constraint. Doing so leads only to small changes and does not improve the quality of fit for any rater. Second, we run neural networks to allow for a non-linear and flexible form of the aggregation function. As neural networks are prone to overfitting, we report the out-of-sample fit. We randomly assign 10% of the firms to a testing set and the rest to a training set. To offer a proper comparison, we compare their performance to the equivalent out-of-sample R2 for the non-negative least squares procedure. We run a one-hidden-layer neural network with a linear activation function and one with a ReLU activation function. Both perform markedly better for MSCI but not for any of the other raters. This implies that the aggregation rule of the MSCI rating is, to some extent, non-linear. The relatively simple explanation seems to be industry-specific weights. In unreported tests, we confirm that the quality of fit for MSCI is well above 0.90 in industry sub-samples, even for a linear regression. Third, we implement a random forest estimator as an alternative non-linear technique. However, this approach yields substantially lower R2 values for most raters.
We also check whether the taxonomy we imposed on the original indicators influences the quality of fit. To this end, we replicate the non-negative least squares estimation of the aggregation rule using the SASB taxonomy (see Table A.4 in the Online Appendix). The quality of fit is virtually identical. Finally, we run an ordinary least squares regression without any taxonomy, regressing each rater’s original indicators on the ratings. The quality of fit is also very similar; the most notable change is a small increase of 0.03 for the MSCI rating. Finally, we perform the regression using data from the year 2017 (without KLD) instead of 2014 (see Table A.8 in the Online Appendix). In this case, the quality of fit is slightly lower for MSCI and Refinitiv, indicating that their methodologies have changed over time. In sum, we conclude that the negative least squares model achieves a high quality of fit and the estimation results are robust.
Arithmetic decomposition
Results from the arithmetic decomposition that implements Equation (8) and relies on the category scores and estimated weights from Section 4. Panel A reports the relative contribution of scope, measurement, and weight to the ESG rating divergence. For convenience, Panel B reports averages per rater based on the values shown in Panel A.
| Panel A: Rater pairs | ||||
|---|---|---|---|---|
| Scope | Measurement | Weight | ||
| KLD | Sustainalytics | 18% | 69% | 13% |
| KLD | Moody’s ESG | 31% | 59% | 10% |
| KLD | S&P Global | 20% | 68% | 11% |
| KLD | Refinitiv | 22% | 63% | 15% |
| KLD | MSCI | 81% | 17% | 3% |
| Sustainalytics | Moody’s ESG | 20% | 64% | 16% |
| Sustainalytics | S&P Global | 22% | 70% | 8% |
| Sustainalytics | Refinitiv | 12% | 66% | 22% |
| Sustainalytics | MSCI | 68% | 30% | 2% |
| Moody’s ESG | S&P Global | 41% | 56% | 3% |
| Moody’s ESG | Refinitiv | 19% | 79% | 2% |
| Moody’s ESG | MSCI | 66% | 41% | –6% |
| S&P Global | Refinitiv | 23% | 74% | 3% |
| S&P Global | MSCI | 59% | 52% | –10% |
| Refinitiv | MSCI | 68% | 38% | –7% |
| Average | 38% | 56% | 6% | |
Panel B: Rater averages | ||||
| Scope | Measurement | Weight | ||
| KLD | 34% | 55% | 10% | |
| Sustainalytics | 28% | 60% | 12% | |
| Moody’s ESG | 35% | 60% | 5% | |
| S&P Global | 33% | 64% | 3% | |
| Refinitiv | 29% | 64% | 7% | |
| MSCI | 68% | 36% | –4% | |
5. Decomposition
So far, we have shown that scope, measurement, and weight divergence exist. In this section, we decompose the overall ratings divergence into the contributions of scope, measurement, and weight divergence. We perform an arithmetic decomposition that relies on the taxonomy, the category scores, and the aggregation weights estimated in Section 4. Scope divergence is partialed out by considering only the categories that are exclusively contained in one of the two ratings. Measurement divergence is isolated by calculating both ratings with identical weights so that differences can only stem from differences in measurement. Weight divergence is what remains of the total difference.
Common categories included in the scope of both raters are denoted as . Exclusive categories included by only one rater are denoted as and . We separate the rating based on common and exclusive categories as follows:
Common and exclusive categories
On this basis, we can provide terms for the contributions of scope, measurement, and weight divergence to the overall divergence. Scope divergence Δscope is the difference between ratings that are calculated using only mutually exclusive categories. Measurement divergence Δmeas is calculated based on the common categories and identical weights for both raters. The identical weights are estimated jointly for two ratings, as specified in Equation (7). This is a non-negative pooling regression of the stacked ratings on the stacked category scores of the two raters. Because the regression optimizes the fit with , we can attribute the remaining differences to measurement divergence. Weight divergence Δweights is simply the remainder of the total difference, or, more explicitly, a rater’s category scores multiplied with the difference between the rater-specific weights and . It must be noted that all these calculations are performed using the fitted ratings and the fitted weights because the original aggregation function is not known with certainty.
Scope, measurement, and weight
Because all ratings are normalized to a zero mean, the total difference between two ratings is equal to zero. Yet the firm-specific differences are different from zero and the variance of provides a summary statistic of these differences. Using the variance as a measure of divergence, Equation (8) yields a straightforward way to calculate the contributions of scope, measurement, and weight to this divergence.
5.1 Results of the Decomposition
Figure 3 provides a firm-specific example of the decomposition. The figure shows in detail how we decompose the rating difference between Refinitiv and KLD for Barrick Gold Corporation. It illustrates how our decomposition completely breaks down the difference between two ESG ratings into category-specific contributions of scope, measurement, and weight.
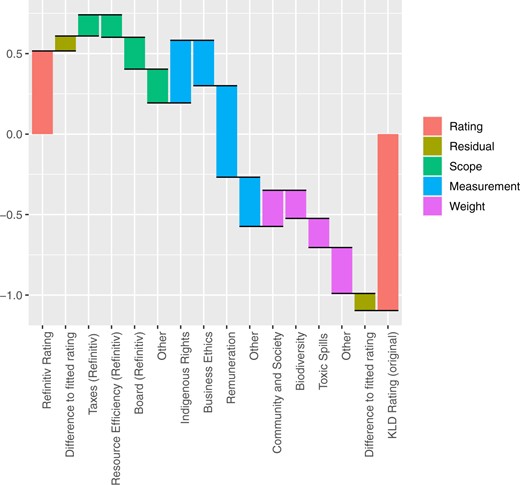
Decomposition example.
Notes: Arithmetic decomposition of the difference between two ESG ratings, provided by Refinitiv and KLD, for Barrick Gold Corporation in 2014. The normalized ratings are on the left and right. The overall divergence is separated into the contributions of scope, measurement, and weight. The three most relevant categories in absolute terms are shown in descending order within each source, with the remainder of the total value of each source labeled as “Other.” The residual between the original rating and our fitted rating is shown in the second bar from the left and from the right, respectively.
The cross-sectional results of the decomposition are presented in Table VIII. On average, across all rater pairs, measurement divergence makes the largest contribution with 56%, followed by scope divergence with 38% and weight divergence with 6%. More than half of the ESG rating divergence can be attributed to ESG rating agencies measuring different values for the same category.
The results for individual rater pairs align nicely with expectations. For example, for the pair KLD–MSCI, measurement divergence contributes only 17%, while scope contributes 81%. This result reflects that those two ratings come from the same provider, are likely based on very similar underlying data, but cover a different scope of attributes. The pair Sustainalytics–Refinitiv, with 22%, has the highest contribution of weight and at the same time, with 12%, the lowest contribution of scope. Sustainalytics and Refinitiv both have many indicators and most categories are covered by both raters. In this case, scope divergence plays a lesser role; instead, there are more categories for which weights can differ. The pair Moody’s ESG–Refinitiv, with 78%, has the highest contribution of measurement divergence. This suggests that those two raters have very similar views on what ESG is about. However, differences remain and these are mainly due to measurement divergence.
Panel B highlights differences between raters. MSCI stands out as the only rater where scope instead of measurement contributes most to the divergence. This result is driven by MSCI’s exposure scores. As described in Section 4, these scores essentially set company-specific weights for each category. As these scores have no equivalent in the other rating methods, they increase the scope divergence of MSCI with respect to all other raters. At the same time, the contribution of weight is negative for MSCI due to a negative covariance between scope and weight divergence. In other words, the effects of scope divergence and weight divergence tend to compensate for each other in the case of MSCI. For all other raters except MSCI, the contribution decreases from measurement to scope to weight.
Our analysis also allows us to identify the categories that are most consequential for measurement divergence across all raters. To this end, we average the absolute measurement divergence by category. It turns out that some categories for which there is pronounced measurement disagreement ultimately do not matter much for rating divergence because they tend to have a small weight in the aggregate ratings. These include Environmental Fines, Clinical Trials, Employee Turnover, HIV Programs, and Non-GHG Air Emissions. On the other end of the spectrum are categories where measurement divergence is very consequential for overall divergence, namely, Climate Risk Mgmt., Product Safety, Corporate Governance, Corruption, and Environmental Mgmt. System. These latter categories are priority targets in terms of addressing measurement divergence.
Since the decomposition is our main result, we subject it to several robustness checks that are available in the Online Appendix. First, we perform the decomposition on the basis of the SASB taxonomy (Online AppendixTable A.5). In this case, the contribution of measurement divergence is even higher (60%). This is consistent with the expectation that as categories become broader, measurement divergence within those categories increases. Second, we perform a regression-based decomposition as an alternative (Online Appendix Section A). Using this method, scope is as important as measurement, but weight continues to play a minor role. Third, we repeat the decomposition with data from 2017 (Online AppendixTable A.9), confirming that measurement divergence is the dominant source of ESG rating divergence in 2017 as well.
Rater effect
This table reports R2 values of different dummy regressions. The dependent variable in each regression is a vector that stacks the scores of all raters and firms for all categories that are common across raters. The independent variables are firm, firm-rater, and firm-category dummies. The difference in R2 between regression 1 and 2 as well as 3 and 4 represents the rater effect.
| Dummies | R2 |
|---|---|
| Firm | 0.22 |
| Firm + Firm–Rater | 0.38 |
| Firm + Firm–Category | 0.47 |
| Firm + Firm–Category + Firm–Rater | 0.62 |
| Dummies | R2 |
|---|---|
| Firm | 0.22 |
| Firm + Firm–Rater | 0.38 |
| Firm + Firm–Category | 0.47 |
| Firm + Firm–Category + Firm–Rater | 0.62 |
6. Rater Effect
To further investigate the underlying reasons for measurement divergence, this section tests for the presence of a “rater effect.” The rater effect describes a bias, where performance in one category influences perceived performance in other categories. This phenomenon is also called the “halo effect” and related biases have been extensively studied in sociology, management, and psychology, especially in performance evaluation (see Shrout and Fleiss, 1979). The process of evaluating firms’ ESG attributes seems prone to a rater effect. Evaluating firm performance in the Human Rights, Community and Society, and Labor Practices categories requires rating agencies to use some degree of judgment. The rater effect implies that when the judgment of a company is positive for one particular indicator, it is also likely to be positive for another indicator. We evaluate the rater effect using two procedures. First, we estimate fixed-effects regressions comparing categories, firms, and raters. Second, we run rater-specific LASSO regressions to evaluate the marginal contribution of each category.
6.1 Rater-Fixed Effects
The baseline regression in Equation (9) explains category scores with firm dummies. The second regression adds the firm-rater-fixed effects, that is, a dummy variable for each firm-rater pair. The increment in R2 between the two regressions is the rater effect. The third and fourth regressions repeat the procedure with the additional inclusion of category-firm-fixed effects. The results of these regressions are shown in Table IX.
We detect a clear rater effect. Firm dummies alone explain 0.22 of the variance of the scores in Equation (9). However, when including firm-rater dummies, the R2 increases to 0.38, an increase of 0.16. Similarly, the difference in R2 between Equations (11) and (12) yields an increase of 0.15. Therefore, the rater effect explains about 0.15–0.16 of the variation in category scores. The rater effect is relevant in comparison to the other dummies. Comparing the estimates of Equations (11) and (9), we find that including firm-category dummies improves the fit by 0.25. Similarly, comparing the outcomes of Regressions 12 and 10 yields an increase of 0.24. Thus, firm dummies explain 0.22, firm-category dummies 0.24–0.25, and firm-rater dummies 0.15–0.16. This means that after controlling for which firm is rated and in which category, the rater itself has a substantial effect on the category score.
6.2 A LASSO Approach to the Rater Effect
We explore the rater effect using an alternative procedure. Here, we concentrate exclusively on the within-rater variation. A rating agency with no rater effect is one in which the correlations between categories are relatively small; a rating agency with a strong rater effect implies that the correlations are high. However, these correlations cannot be accurately summarized by pairwise comparisons. Instead, we can test for the correlations across categories using LASSO regressions. The idea is that a strong rater effect implies that the marginal explanatory power of each category within a rater is diminishing when categories are added one after another. This implies that one could replicate an overall rating with less than the full set of categories.
Figure 4 shows the increase in R2 for each rating agency. The last part of the curve to the right coincides with an unrestricted OLS estimate where all variables are included. KLD and MSCI have the smallest cross-category correlation, judging by the slope in Figure 4(a) and (f). In contrast, the slopes for Sustainalytics, Moody’s ESG, Asset 4, and S&P Global suggest that only a few categories already explain most of the ESG rating. For S&P Global, 10% of the categories explain 75% of the rating.
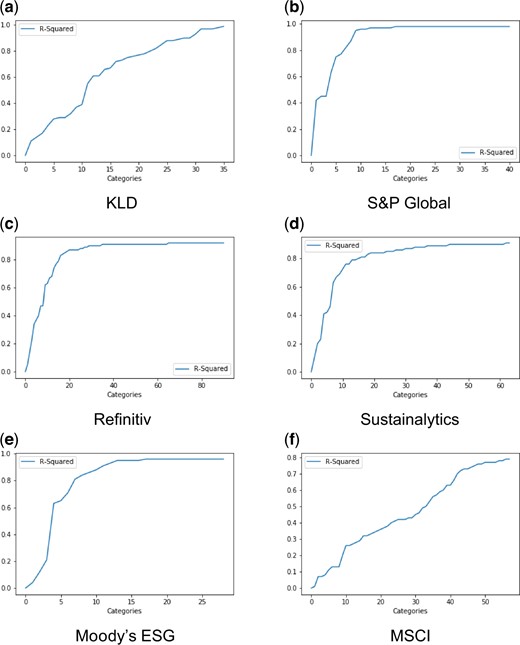
LASSO regressions. (a) KLD. (b) S&P Global. (c) Refinitiv. (d) Sustainalytics. (e) Moody’s ESG. (f) MSCI.
Notes: The plots show the R2 values of a series of LASSO regressions, regressing the aggregate ESG rating of the different rating agencies on the categories of the same rater. The x-axis shows how many indicators are used as covariates and the y-axis indicates the corresponding R2 value.
The rater effect suggests that measurement divergence is not only randomly distributed noise. Instead, a part of the divergence follows a pattern that suggests structural reasons. A potential explanation for the rater effect is that rating agencies are organized so that analysts specialize in firms rather than indicators. A firm that is perceived as good in general may be seen through a positive lens and receive better indicator scores than a firm that is perceived as bad in general. In discussions with S&P Global, we learned about another potential cause for such a rater effect. Some raters make it impossible for firms to receive a good indicator score if they do not give an answer to the corresponding question in the questionnaire. This happens regardless of the actual indicator performance. The extent to which the firms answer specific questions may be correlated across indicators. Hence, the rater effect could also be due to rater-specific assumptions that systematically affect assessments. There could also be economic incentives that affect measurement. For example, Cornaggia, Cornaggia, and Hund (2017) suggest that credit raters may have incentives to inflate certain ratings. An interesting avenue for future research is whether ESG raters have similar incentives to adjust their ratings.
7. Conclusions
The contribution of this article is a decomposition of ESG ratings divergence. Chatterji et al. (2016) have taken an important first step by distinguishing two aspects that matter, first, how ESG raters define what they intend to measure, and second, how they measure it. However, their analysis leaves open to what extent these two aspects drive divergence. As a result, the difference between any two ratings remains difficult to interpret. In this paper, we decompose the divergence into the elements of scope, weight, and measurement. Scope and weight reflect what an ESG rating intends to measure, whereas measurement reflects how it is measured. We show that measurement divergence is the main driver of ESG rating divergence. Our findings demonstrate that ESG rating divergence is not merely a matter of varying definitions but a fundamental disagreement about the underlying data. It is legitimate that different raters take different views on which categories are most important in ESG evaluation. A variety of opinions may be desirable given that the users of ESG ratings also have heterogeneous preferences for scope and weight. However, measurement divergence is problematic if one accepts the view that ESG ratings should ultimately be based on objective observations that can be ascertained.
The second contribution of this paper is on the methodological front. This is the first paper that compares several ESG ratings based on the full set of underlying indicators. We demonstrate that it is possible to re-estimate ESG ratings based on a common taxonomy imposed on the data. At the firm level, this explains why two different ESG rating methods produce different assessments. In the aggregate, it allows identifying the categories that are most important in driving ESG rating divergence. Measurement divergence is most influential in the categories Climate Risk Mgmt., Product Safety, Corporate Governance, Corruption, and Environmental Mgmt. System. These categories are natural starting points for further research into enhancing measurement approaches in ESG ratings.
Third, we document a rater effect. Raters’ assessments are correlated across categories so that when a rating agency gives a company a good score in one category, it tends to give that company good scores in other categories, too. The rater effect suggests that measurement divergence is not merely noise but that patterns influence how firms are assessed. Although we do not conclusively identify the cause of the rater effect, one possible explanation is that ESG rating agencies divide analyst labor by firm and not by category so that an analyst’s overall view of a company could propagate into the assessments in different categories. A promising avenue for future research is to investigate additional reasons why ESG ratings might deviate systematically in their assessment, for example, whether economic incentives to adjust ratings exist.
Our results have important implications for researchers, investors, companies, rating agencies, and regulators. Researchers should carefully choose the data that underlie future ESG studies. Results obtained on the basis of one ESG rating might not replicate with the ESG ratings of another rating agency. In particular, our results indicate that divergence is very pronounced for KLD—the data on which the majority of existing academic research into ESG has been based so far. Researchers have three options when it comes to dealing with the divergence of ESG ratings. One is to include several ESG ratings in the analysis (see, e.g., Liang and Renneboog, 2017). This is reasonable when the intention is to measure “consensus ESG performance” as it is perceived by financial markets in which several ratings are used. Second, researchers may use one particular ESG rating to measure a specific company characteristic. In this case, one must carefully explain why the specific rating methodology is the most appropriate for the study. Third, researchers can construct hypotheses around more specific sub-categories of ESG performance, such as GHG Emissions or Labor Practices. This avoids the problems of weight and scope divergence, but the risk of measurement divergence remains. Therefore, researchers should ideally work with raw data that can be independently verified. If that is not feasible, researchers should carefully examine how the data are generated and remain skeptical of data where the data generation process is not entirely transparent. When high-quality data are not available, researchers should also consider collecting ESG data themselves and sharing the data set. In short, given the ESG rating divergence, any research using ESG ratings or metrics needs to pay special attention to the validity of the data used.
Turning to investors, our methodology enables them to understand why a company has received different ratings from different rating agencies. The example in Figure 3 illustrates how investors can disentangle the various sources of divergence and trace a result to specific categories. For instance, investors could reduce the discrepancy between ratings by obtaining indicator-level data from several raters and then imposing their own scope and weight. The remaining measurement divergence could be traced to the indicators that are driving the discrepancy, guiding an investor’s additional research. Averaging indicators from different providers is an easy way to eliminate measurement divergence as well. However, the rater effect suggests that this approach may be problematic because the discrepancies are not randomly distributed. Alternatively, investors might rely on one rating agency after convincing themselves that scope, measurement, and weight are aligned with their objectives.
For companies, our results highlight the substantial disagreement about their ESG performance. This divergence occurs not only at the aggregate level but is actually even more pronounced in specific sub-categories of ESG performance. This creates uncertainty about how to formulate concrete ESG targets. Improving scores with one rating provider will not necessarily result in improved scores at another. Especially when firms tie executive compensation or borrowing conditions to specific ESG metrics, there is a significant risk that improvements in these metrics will not be reflected in ESG ratings that use other metrics. Thus, firms should ensure that the metrics used for their own purposes support their underlying goals and that reaching those goals is also recognized by raters. To achieve that, companies should work with rating agencies to establish appropriate metrics and ensure that the data they themselves disclose are publicly accessible.
Regarding rating agencies, our results call for greater transparency. First, ESG rating agencies should clearly communicate their definition of ESG performance in terms of scope of attributes and aggregation rules. Second, rating agencies should become much more transparent with regard to their measurement practices and methodologies. Greater methods transparency would allow investors and other stakeholders, such as rated firms, NGOs, and academics, to evaluate and cross-check the agencies’ measurements. Also, rating agencies should seek to understand what drives the rater effect to avoid potential biases.
Finally, regulators could address the issue of ESG rating divergence. First, harmonizing ESG disclosure by firms would provide a foundation of reliable and freely accessible data for all ESG ratings. Second, regulators could help to make ESG rating divergence more intelligible and foster competition on the quality of measurement. As our taxonomy has shown, matching indicators to consistent categories is a difficult exercise. However, some form of categorization is essential to understanding why and where ESG rating methodologies differ from each other. Requiring ESG rating agencies to map their data to a common taxonomy would make such a comparison much simpler. Doing so may also spur competition because investors could more easily complement or replace the measurement of a specific category with data from an alternative provider. Such an approach would leave raters the freedom to maintain proprietary and innovative methodologies while improving the comparability of ESG ratings.
Supplementary Material
Supplementary data are available at Review of Finance online.
Funding
R.R. and F.B. are grateful to Massachusetts Pension Reserves Investment Management Board, AQR Capital Management, MFS Investment Management, AssetOne Asset Management, and Qontigo—members of the Aggregate Confusion Project Council—for their generous support. J.F.K. gratefully acknowledges financial support of the BMW Foundation Herbert Quandt.
Footnotes
We thank Alex Edmans and an anonymous referee for helpful comments; Suraj Srinivasan and three anonymous referees at Management Science for helpful comments on an earlier version of this manuscript; and all the ESG rating agencies that provided their data to this project. We also thank Andrew King, Eric Orts, Jason Jay, Kathryn Kaminski, Lisa Goldberg, René Bohnsack, Robert Eccles, Stefano Ramelli, Thomas Lyon, Timo Busch, and Yannick Le Pen, as well as participants at the AFA conference, the EFA conference, the GRASFI conference, the Gronen conference, the Frankfurt School of Finance ESG seminar, the JOIM seminar, the Fondazione Eni Enrico Mattei webinar, the COIN Seminar at the JRC of the European Commission, the Harvard Kennedy School M-RCBG seminar, the Wharton Business Ethics seminar, the Geneva Sustainable Finance Summit, the Liechtenstein Sustainable Finance Workshop, and the Brown Bag Lunch Finance Seminar at the University of Zurich for their inputs. Jonathan Hsieh, Armaan Gori, Andrew Lu, Erin Duddy, Sanjana Rajaram, and Nadya Dettwiler provided excellent research assistance. All remaining errors are ours. R.R. and F.B. are grateful to Massachusetts Pension Reserves Investment Management Board, AQR Capital Management, MFS Investment Management, AssetOne Asset Management, and Qontigo—members of the Aggregate Confusion Project Council—for their generous support. J.F.K. gratefully acknowledges financial support of the BMW Foundation Herbert Quandt.
ESG ratings are also referred to as sustainability ratings or corporate social responsibility ratings. We use the terms ESG ratings and sustainability ratings interchangeably.
Scope and weight combined are equivalent to theorization and one could argue that an attribute that is out of scope has a weight of zero. However, in practice, rating agencies do not collect data for attributes that are beyond their scope. There is thus a qualitative difference between an attribute with zero weight and an attribute for which data are not available.
Founded in 2011, SASB works to establish disclosure standards on ESG topics that are comparable across companies on a global basis.
Because credit ratings are expressed on an ordinal scale, researchers usually do not report correlations. For the sake of illustration, we use the data from Jewell and Livingston (1998) and calculate a Pearson correlation by replacing the categories with integers.
KLD, formerly known as Kinder, Lydenberg, Domini & Co., was acquired by RiskMetrics in 2009. MSCI bought RiskMetrics in 2010. The data set was subsequently renamed to MSCI KLD Stats as a legacy database. We keep the original name of the data set to distinguish it from the MSCI data set.
All raters, except for KLD, in our sample are featured in the 2019 and 2020 investor survey, “Rate the Raters,” performed by the SustainAbility Institute (see https://www.sustainability.com/globalassets/sustainability.com/thinking/pdfs/sustainability-ratetheraters2020-report.pdf). Other raters included in this list are CDP, Bloomberg, ISS, and FTSE. CDP and Bloomberg were ruled out as CDP focuses only on environmental issues and Bloomberg mostly on the quality of disclosure. ISS was unable to provide granular data. FTSE Russel merged with Refinitiv and is no longer an independent rating. Calvert is not mentioned in the survey and we thus did not include them contrary to Chatterji et al. (2016).
The KLD data set does not provide an aggregate rating; it only provides binary indicators of “strengths” and “weaknesses.” We created an aggregate rating for KLD by following the procedure that is chosen in most academic studies—namely, summing all strengths and subtracting all weaknesses (see, e.g., Lins, Servaes, and Tamayo, 2017).
